Creating a Timeline Chart
Complete the following steps to create a timeline chart with two series:
-
Place a chart control on a page in Application Designer.
-
Create an instance of the Timeline class in PeopleCode.
&oTChart = GetTimeline(QE_CDEMO_WRK.QE_CHART_TIMELINE); -
Specify labels for the series.
&oTChart.SetSeriesLabels(CreateArray("TimeLine Series 1", "TimeLine Series 2")); -
Set the scale of the major axis.
&oTChart.MajorAxisScale = "quarters"; -
Set the scale of the minor axis.
&oTChart.MinorAxisScale = "months"; -
Set zoom order of the timeline.
&oTChart.MinorAxisZoomOrder = CreateArray("months", "weeks"); -
Specify start time of the timeline.
&oTChart.Start = DateTimeValue("2012-11-01 00:30:40.12-0600"); -
Specify end time of the timeline.
&oTChart.End = DateTimeValue("2013-12-30 00:30:40.12-0600"); -
Set the record for chart data.
&oTChart.SetData(Record.QE_TLINE_DATA); -
Specify the field representing the identifier for the time line series.
&oTChart.SetDataSeries(QE_TLINE_DATA.QE_TIMELINE_SERIES); -
Specify the field for the start time of the timeline item.
&oTChart.SetDataItemStart(QE_TLINE_DATA.QE_TIMELINE_START); -
Specify the field for the description to display on the timeline item.
&oTChart.SetDataItemDescription(QE_TLINE_DATA.QE_DESCR50); -
Specify the field for the title to display on the timeline item.
&oTChart.SetDataItemTitle(QE_TLINE_DATA.QE_CHARTTITLE); -
Specify the timeline orientation.
&oTChart.Orientation = %Chart_Vertical;
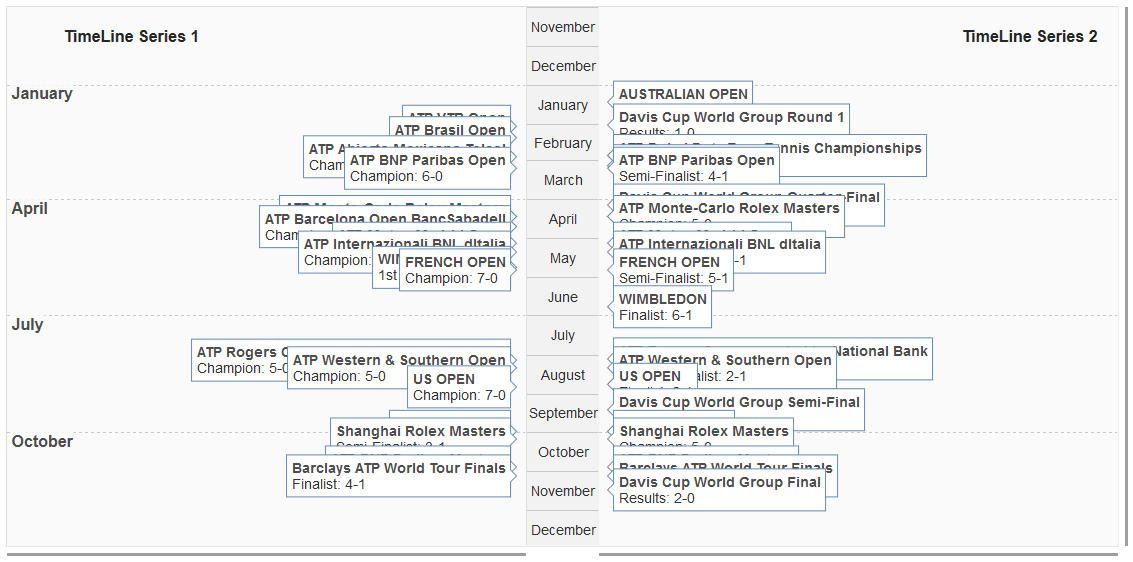
The preceding lines of PeopleCode generate the following timeline chart assuming that sample data is provided for the chart.
A resulting timeline chart.