Fluid Mode Considerations for Charts and Gauges
Defining charts and gauges for fluid pages is very similar to defining charts and gauges for classic mode. There are some key differences that you need to take into account.
The following information is specific to the following classes:
-
Chart class
-
DialGauge class
-
LEDGauge class
-
RatingGaugeChart class
-
StatusMeterGauge class
-
SparkChart class
Each Chart Must be Enclosed by a Dedicated Group Box
In Application Designer, always place the chart control within a group box and ensure that no other controls are within the group box.
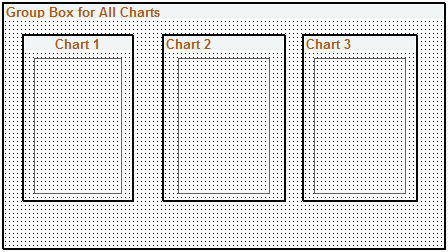
In this example, there are three charts on this fluid page. Each is in its own group box, and all three charts and their group boxes are within a containing group box:
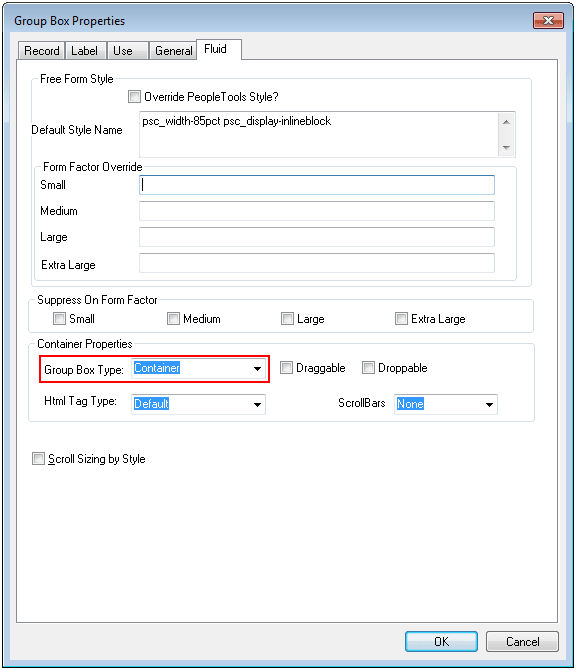
The group boxes that immediately contain the chart controls must be defined as Container group boxes:
You can specify other styles as well to help position the chart or gauge within the page.
Specifying Chart Dimensions
When a chart or gauge is placed on a fluid page, the width, height, and aspect ratio are all considered when determining its size. Each chart should be contained by a group box that only has that chart within it.
The width of the chart is determined by the width of the parent group box that contains the chart. The width of the group box (and therefore the chart) can be further controlled by applying a style in the Fluid tab of the group box control in Application Designer.
The height of the chart is determined by the width of the chart and the AspectRatio property. The height will be calculated as the width multiplied by the aspect ratio. If no AspectRatio property is provided, the Height property will be used to determine the fixed height of the chart or gauge.
Note:
The AspectRatio property does not apply to the DialGauge class; use the Height property instead.
Important:
If both the Width and Height properties are supplied with no AspectRatio property, they will be used to produce a fixed size chart or gauge. This chart will not be realizable once its rendered.
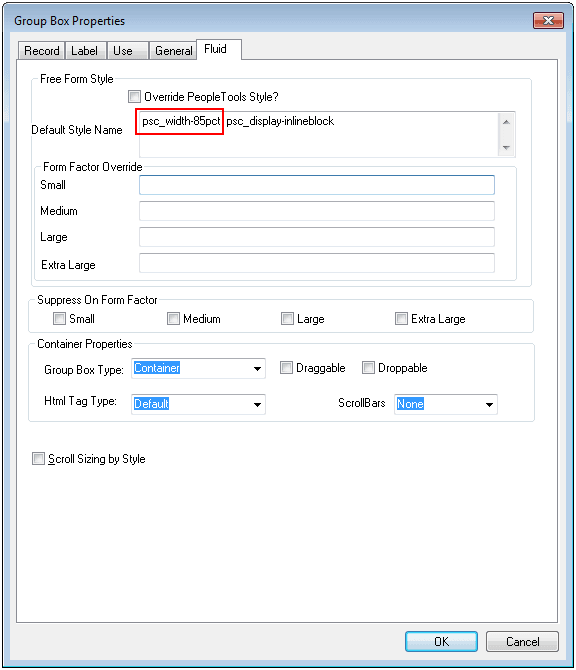
On the Fluid tab of
the enclosing group box, add a style that specifies the width of the
container. The chart will use this information to dynamically determine
its width. In this example, the containing group box is styled to
use 85% of the container (that is, the group box) that contains it:
psc_width-85pct
If necessary, you can
specify overrides for different form factors to achieve an appropriately
sized chart or gauge.
Typically, you specify the height of the chart or gauge as a proportion of the width by assigning a value to the AspectRatio property in PeopleCode. Here’s an example:
&cChart.AspectRatio = 0.8;The AspectRatio property value should be greater than 0. If this property is not specified, the default value of 1 is used. AspectRatio is a property of the following classes:
-
Chart class: AspectRatio property: Chart class
-
LEDGauge class: AspectRatio property: LEDGauge class
-
RatingGaugeChart class: AspectRatio property: RatingGaugeChart class
-
StatusMeterGauge class: AspectRatio property: StatusMeterGauge class
-
SparkChart class: AspectRatio property: SparkChart class