Specifying Time Line Axis Formats
The date-time axis (the x-axis) of a Gantt chart is referred to as the “time line” axis. You can control the display label format for the time line through a combination of user personalization settings and various Gantt class methods for setting date entity formats. These settings and methods are described in this documentation. The time line’s start and end can also be adjusted by using the Timeline Range picker or by using the AxisStartDateTime and AxisEndDateTime methods. If none of the properties or methods is set for controlling the time line, then the charting engine plots the time line based on the time difference between the earliest start date and latest end date of all tasks in the Gantt chart.
The time line axis can display the following units of measure: years, months, days, hours, minutes, and seconds. The time line does not support the following units: centuries, quarter years (such as Q1, Q2, and so on), weeks, and milliseconds.
Depending on the time difference between the earliest start date/time and latest end date/time of the data displayed in the Gantt chart, the chart is displayed with a minor axis only, or with major and minor axes.
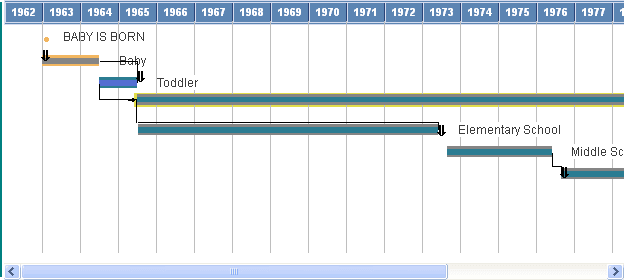
The following Gantt chart displays a minor axis only due to the wide range between the start and end dates of the displayed data:
Valid pairs of major and minor axes include:
-
Year and month
-
Month and day
-
Day and hour
-
Hour and second
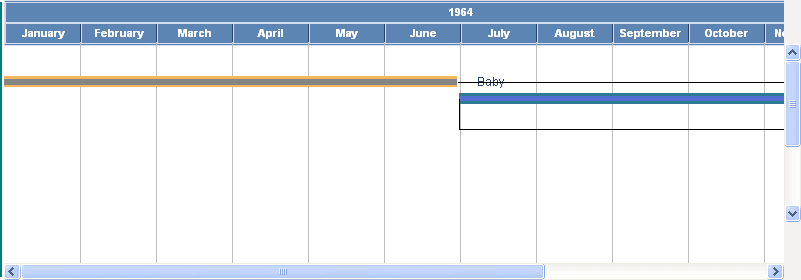
The following Gantt chart displays both a major and a minor axis:
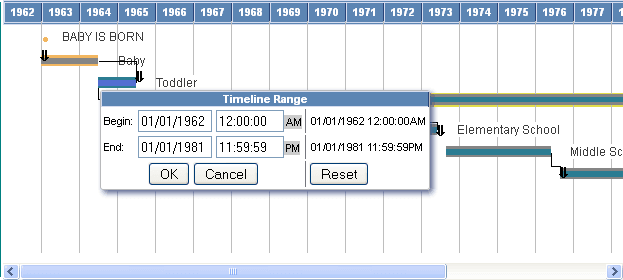
The Timeline Range picker is activated by a clicking a date on the time line. Use the Timeline Range picker to specify the start and end date and time for the data to be displayed in the Gantt chart:
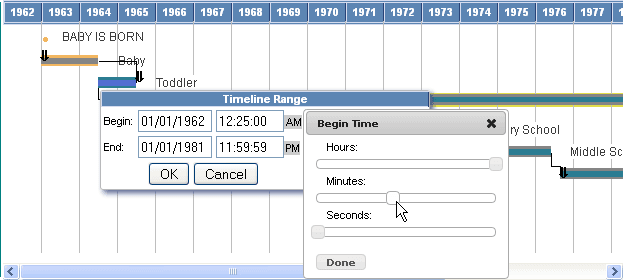
The date slider is activated by clicking a time in the Timeline Range picker. Click AM or PM to toggle between these two settings.