Using Gantt Charts in the PeopleSoft Pure Internet Architecture
The Gantt chart consists of two sections: a table section and a chart section.
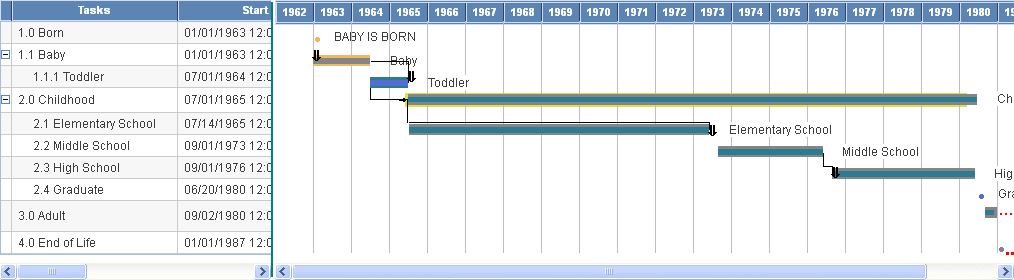
The left side of the chart, where you see the table, is the table section. The other side, where you see the bars, is the chart section. Horizontal scroll bars below the table section support scrolling through the task-related columns; below the task section, they support scrolling through the charted tasks. Vertical scroll bars (when present) support scrolling through the task list.
Table Section
The table section contains all of the tasks and associated subtasks, and displays them in a hierarchy. Tasks that contain subtasks are called parent tasks, and subtasks are called child tasks. You can click on the expand (collapse) image to the left of the task name (Baby, above) to expand or collapse the subtask hierarchy. Note that subtasks may also act as parent tasks to other subtasks.
Each task has a name (Born, Baby, Childhood, and so on). It also has a level. Parent tasks have a higher level than child tasks.
Chart Section
The chart section displays the tasks, task dependencies, and milestones graphically.
In the previous example, each horizontal bar represents a single task. The progress bar (that is, the percentage complete for a particular task) is indicated with a bar of a different color above the task bar. The milestone date (Graduate in the previous example) is represented with a circle.
You can also have dependencies between tasks. These are represented as lines connecting the task bars.
You can execute custom FieldChange PeopleCode when a user clicks a task bar or a task dependency line.
User Interaction
A user can interact directly with a chart to change the underlying chart data.
These user actions are supported:
-
Resize the task bar.
-
Reposition the task bar.
-
Reposition a milestone glyph.
-
Move the separator between the table section and the chart section.
-
Update task details, task start time and end time, and the progress bar.
When a user changes values in the chart section by dragging and dropping bars, the Planned Start, Planned End, and Progress values in the grid column will also be updated if the grid and the chart section use the same record and fields.
Note:
Drag-and-drop is not supported on an Apple iPad.
You can control the level the user is able to interact with the chart using the Gantt class properties InteractiveStart, InteractiveEnd, InteractiveProgress, and InteractiveMove.
See InteractiveStart property: Gantt class, InteractiveEnd property: Gantt class, InteractiveProgress property: Gantt class, InteractiveMove property: Gantt class.