Using Rating Box Charts in PeopleSoft Applications
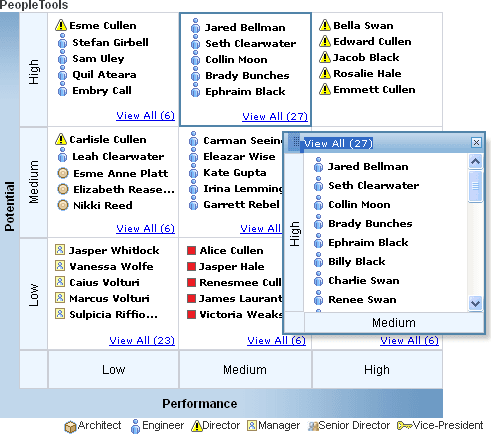
A rating box chart displays nodes on a chart that is divided into two or more quadrants arrayed in a grid.
An application can correlate nodes, represented by icons, with various entities, such as employees, customers, or products, and various attribute pairs, such as potential/performance, cost/benefit, or opportunity/risk.
A user interacts with the rating box by dragging nodes to different quadrants. When a node is moved, its underlying x (horizontal) and y (vertical) values are updated. A user can also interact with the rating box by changing a node’s x or y values in the grid that contains the rating box values if the application makes the grid visible and editable.
To drag and drop a node using an Apple iPad, tap the node's description. A copy of the node with a red dashed border appears. Then tap the quadrant to which you want to move the node. The node appears in the new location.
The View all pop-up automatically closes if the user moves a node to another quadrant.
Using PeopleCode, you can associate each node with an image, or icon, and a description. You can configure a rating box to display nodes with icons and descriptions or with only icons.
If a quadrant contains more nodes than the number set in the RatingBoxChart property BoxMaxDisplayItems, the user can click a link at the bottom of the quadrant to launch a pop-up that contains all the nodes. The quadrant border changes color to indicate that the quadrant has a pop-up open. A vertical scrollbar enables the user to scroll through all the nodes in the list as shown in this example:
Related Topics