PSAPPSRV Visualizations
The PSAPPSRV Visualizations section of the dashboard displays high-level information about PSAPPSRV processes.
This example illustrates the fields and controls on the PSAPPSRV Visualizations section. You can find definitions for the fields and controls later on this page.
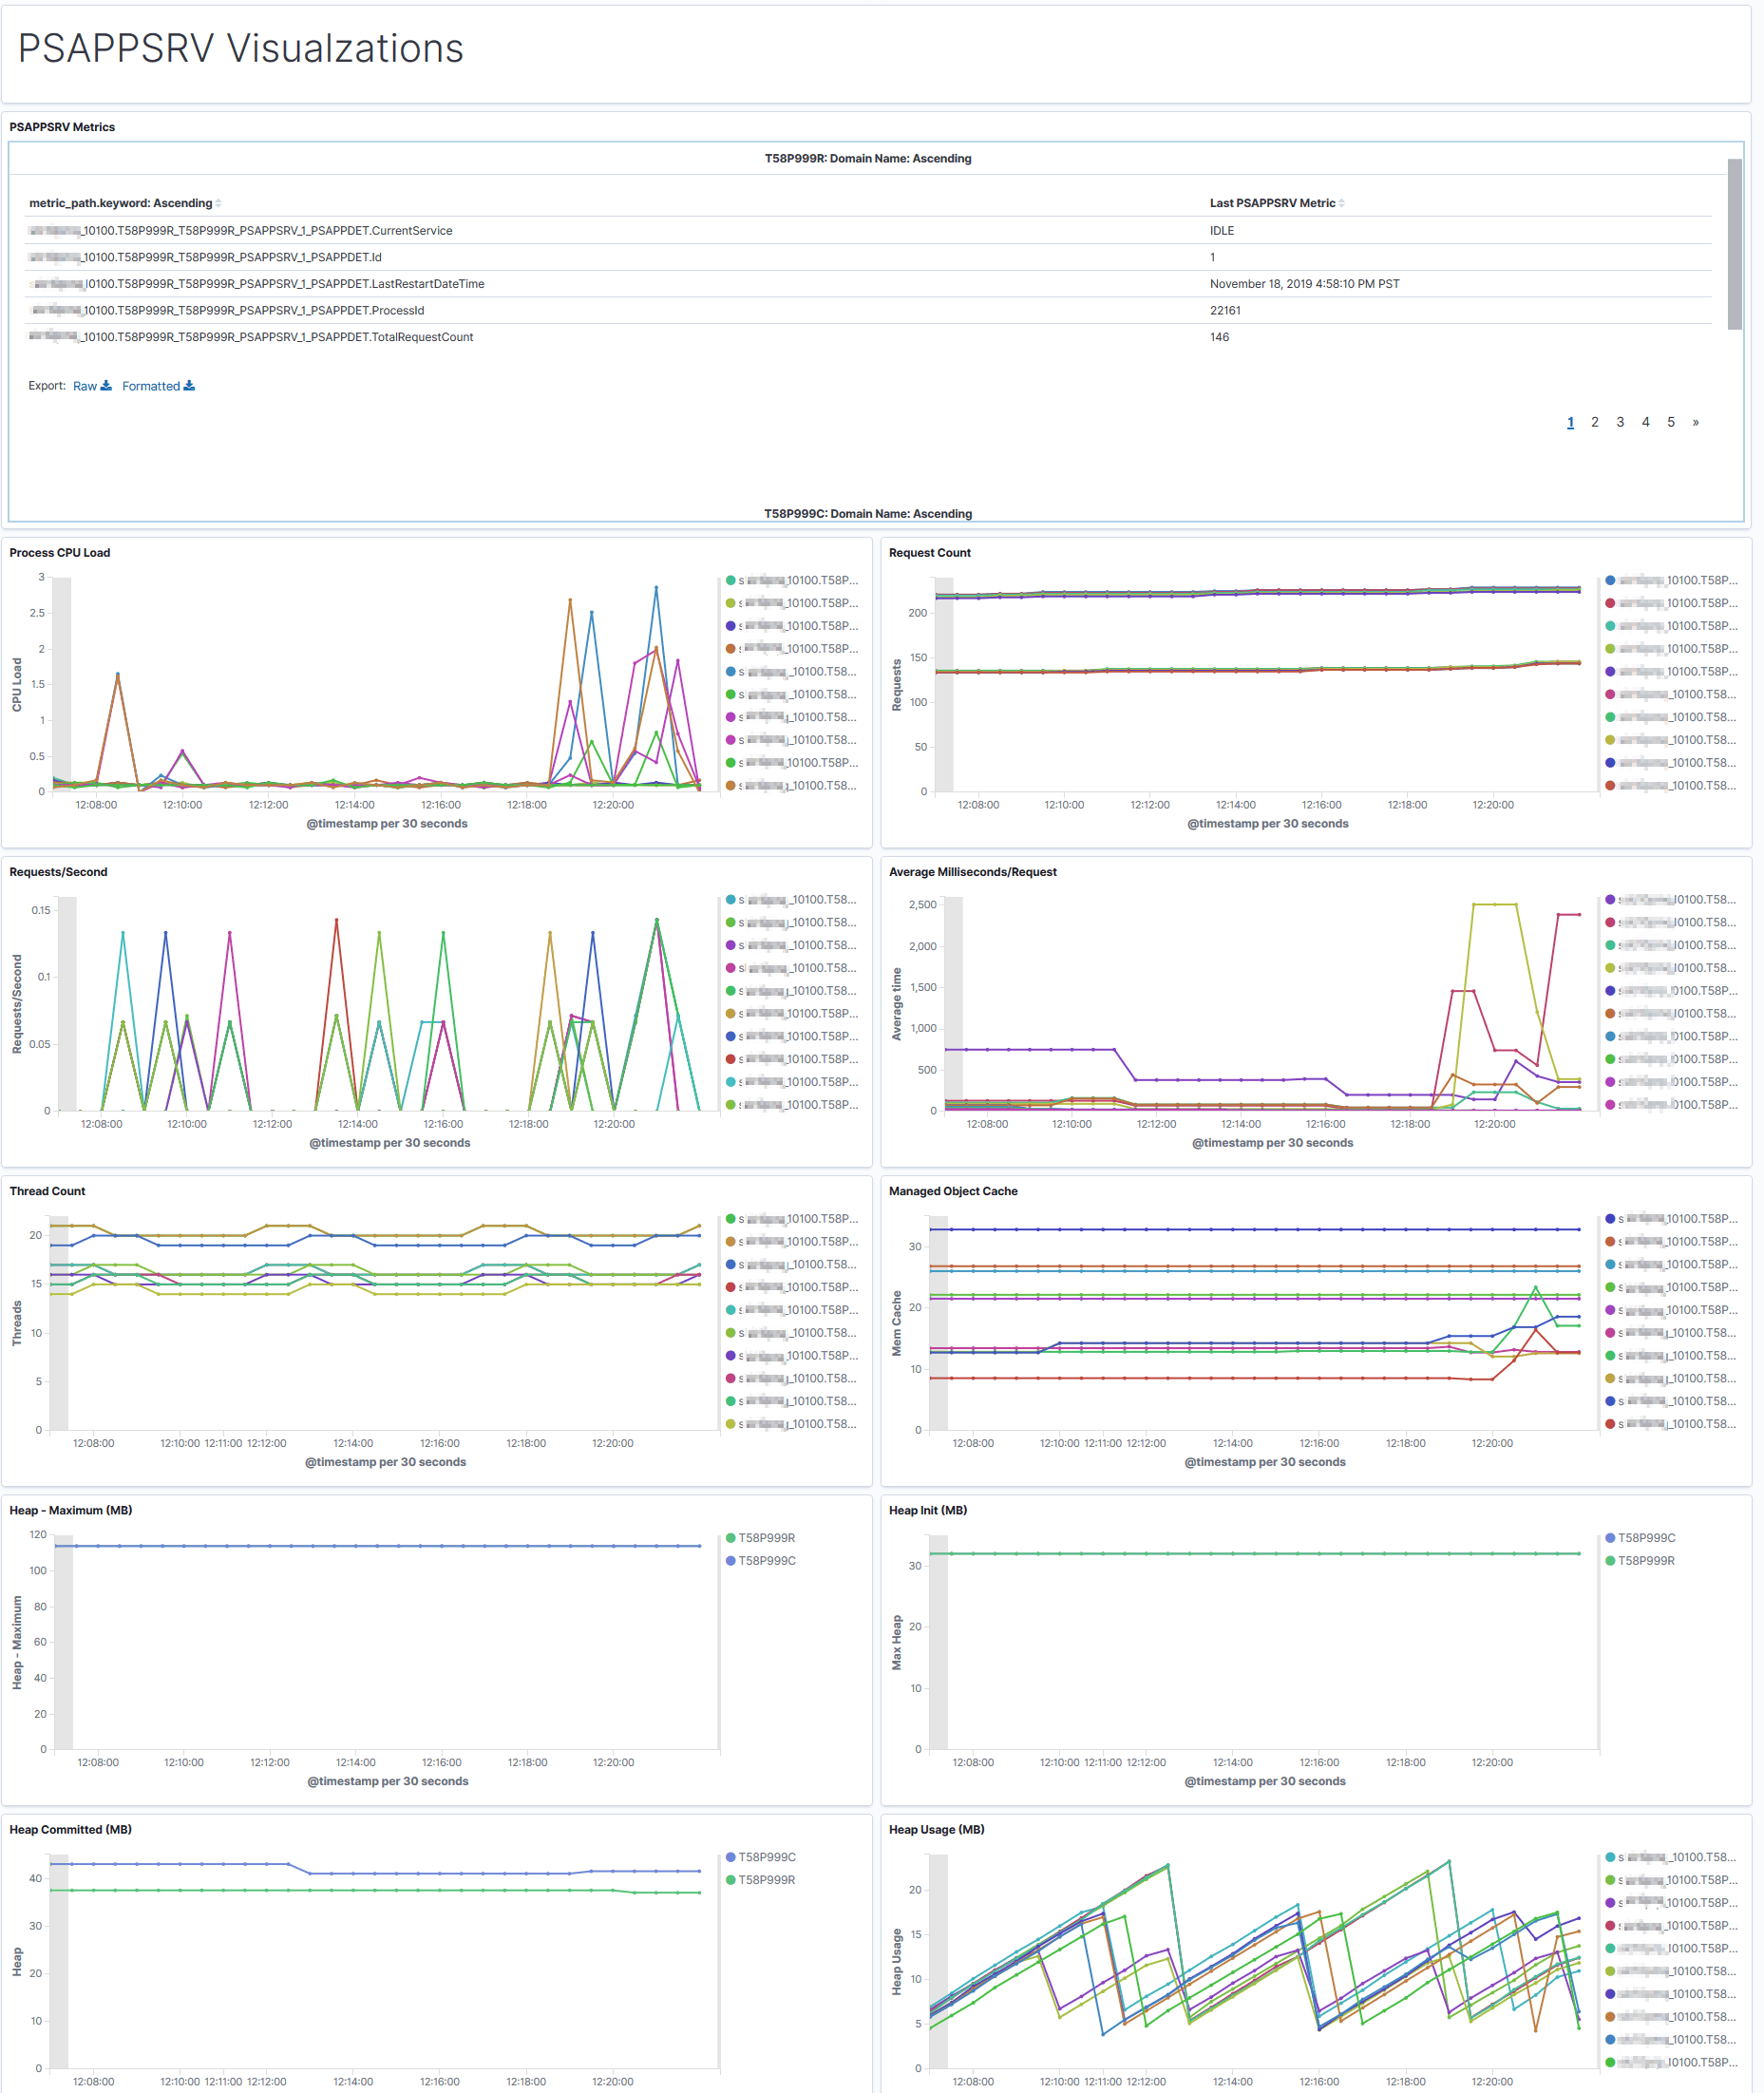
A domain can contain multiple instances PSAPPSRV, and they are identified as PSAPPSRV_1, PSAPPSRV_2 and so on. The metric path indicates the PSAPPSRV process about which the details are provided. The metric path identifies the PSAPPSRV process.
| Field or Control | Description |
|---|---|
|
CurrentService |
The Tuxedo service currently being processed by the server. The value is IDLE if no request is being processed. |
|
Id |
The instance ID of PSAPPSRV. For example, if a domain contains 3 instances of PSAPPSRV, they are identified as PSAPPSRV_1, PSAPPSRV_2, and PSAPPSRV_3. |
|
LastRestartDateTime |
The time when a process was last started. |
|
ProcessId |
The system-level process ID associated with the process. |
|
TotalRequestCount |
The total number of requests processed by the PSAPPSRV process. |
|
Process CPU Load |
The CPU utilization (in percentage) by each active PSAPPSRV process in the domain. Note: If PSAPPSRV CPU usage is high, then some PIA requests are using high levels of resources. |
|
Request Count |
The number of requests completed since the PSAPPSRV process was started. This is a run-time attribute that is kept during server restart, but is lost at server shutdown. |
|
Requests/Second |
The mean number of requests the server processed per second over a recent time period. |
|
Average Milliseconds/Request |
The average time (in milliseconds) taken by the server to process a request since the server was started. |
|
Thread Count |
The number of threads in the process. |
|
Managed Object Cache |
Memory allocated to cache. |
|
Heap Maximum |
A graphical visualization of the maximum amount of memory (in MB) allocated for the heap. |
|
Heap Init |
A graphical visualization of the amount of memory (in MB) allocated for the heap when JVM started. |
|
Heap Committed |
A graphical visualization of memory (in MB) currently allocated for the heap. |
|
Heap Usage |
A graphical visualization of the amount of heap memory (in MB) currently in use by JVM. Note: If the JVM heap usage is very high or the number of rejected requests is high, there may be too much traffic directed to the Web server instance. To resolve, add more Web servers either on the same host, if the host can handle more load, or on a different host that can accommodate the load. |