Working with Completed PMUs
At the bottom of the Completed PMUs page, the Completed PMUs grid contains the information that is related to the PMUs that are retrieved by your search criteria. The tabs in the Completed PMUs page are discussed in the following sections.
Summary
| Field or Control | Description |
|---|---|
|
PMU |
Indicates the name of the PMU. Click the PMU name to view the PMU Details page. |
|
Duration |
Indicates the duration of the PMU from start to finish in milliseconds. |
|
Complete Tree |
Click the tree icon to view the complete PMU tree, including all ancestor and descendant PMUs. |
|
PMU Details |
Provides further description of the PMU. The details comprise contexts and metrics that are helpful for identifying the PMU. Each type of PMU displays a different set of details. |
|
User |
Indicates the user whose request triggered the PMU. |
|
PMU Status |
Displays the PMU status. See Completed PMU Status. |
|
Monitor Received Date/Time |
Indicates when the monitor system received notification that a PMU had been started or updated. |
|
Agent Start Date/Time |
Indicates that time according to the agent clock that the last update was received. |
|
Domain Name |
Indicates the domain that handled the request that is associated with the PMU. |
Identifiers
The Identifiers tab presents the following additional information.
| Field or Control | Description |
|---|---|
|
PMU Set |
Identifies the set to which the PMU ID belongs. |
|
PMU ID |
Identifies a PMU definition within a PMU set. |
|
Agent ID |
Identifies the agent that reported the PMU. |
|
Process ID |
The operating system process ID of the process that generated the PMU. |
|
Instance |
A unique identifier that is generated by the system for each PMU. |
|
Parent Instance |
The PMU that produced the PMU in this grid row. |
|
Top Instance |
Each PMU that is reported by an agent has a unique instance ID. The instance identifier of the first PMU that is generated by a particular user request is the top instance. The value of the top instance is then stored with every child PMU within a request. The top instance is the value that associates all PMUs that are generated by the same user request. |
Contexts
The Contexts tab reveals the context definition and value that is associated with each PMU in the grid. To view the details of the contexts in a PMU, examine the context and PMU definitions.
This Description column shows data for the additional description value that is part of the incoming PMU. The description stores large character values and generally stores information that exceeds the 128–character limit of Metric 7 and the 254–character limit of the contexts.
See Context Definitions.
Metrics
The Metrics tab presents the metric values for all of the metrics that are defined for each PMU in the grid.
Metric information appears in a raw format. The values reflect exactly what is stored in the database.
See Metric Definitions.
Trees
The Trees tab enables you to view the PMU within the context of a PMU tree.
| Field or Control | Description |
|---|---|
|
View Ancestors |
Shows all parent PMUs for the selected PMU. This may be useful in determining the call tree of a child PMU. Only direct ancestors appear; sibling PMUs do not appear. |
|
View Descendants |
Shows all child PMUs for the selected PMU. This may be useful in determining where the time is spent for a PMU. |
|
Complete Tree |
Displays the entire tree representing the user request. If verbose or debug filters are set, this tree may contain a large number of nodes and may take a significant amount of time to load. |
Metric Charts
When your search criteria includes a PMU set and PMU identifier, all rows in the grid will be of the same type of PMU. In this case, the metric chart displays the metric values of the returned PMUs against one another. This enables you to track metrics over a period of time.
This example illustrates the fields and controls on the Viewing a metric chart.
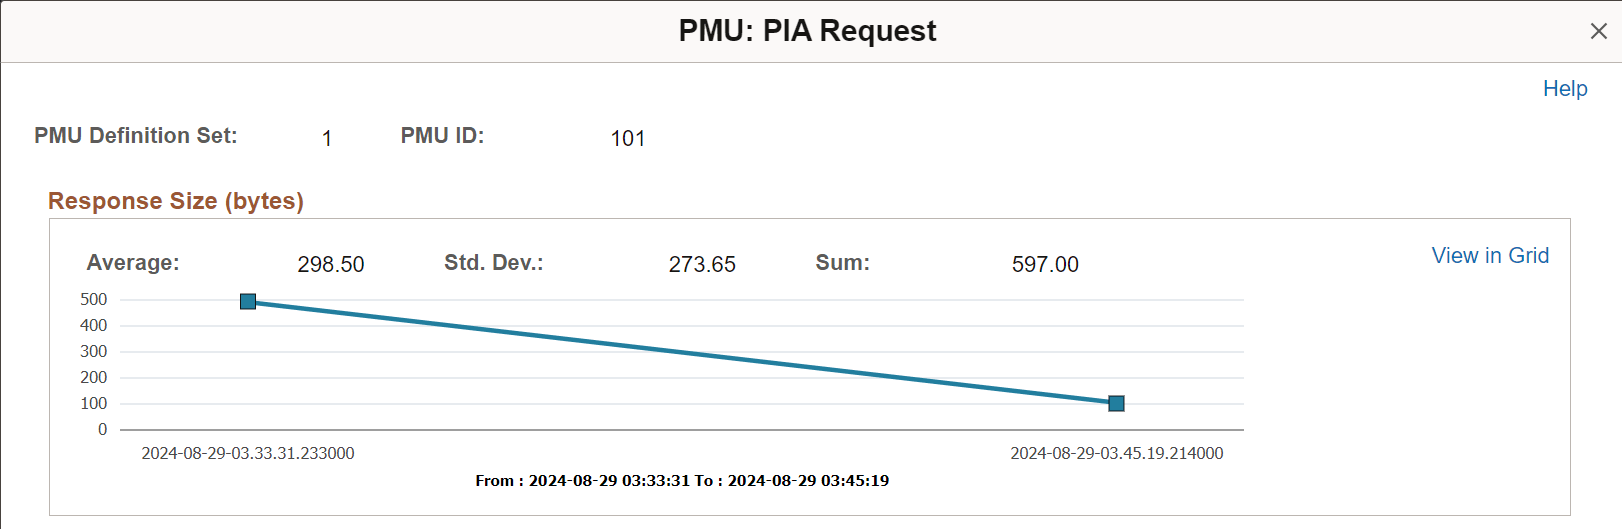
Numeric metrics may be of type Counter, Gauge, or Numeric Identifier. Numeric identifiers do not appear in charts. Gauges and counters do appear in charts, but the chart does not contain a sum value for gauges.
Use the View in Grid link to view the chart information in a grid so that you can download the information to an Microsoft Excel spreadsheet if needed.
Note:
If the metrics of a PMU can't be charted, a message appears stating this fact.
Note:
To view the metric chart, you must specify a PMU and PMU set ID as part of the search criteria. If you click this link when performance data for multiple PMUs appears, the system displays an error message.
Note:
The data appearing on this chart is not manipulated by multipliers, if any are used.
See Metric Definitions.
Duration Charts
The duration charts show all durations for all PMUs appearing in the grid. The chart is time-based.
This example illustrates the fields and controls on the Viewing a duration chart. You can find definitions for the fields and controls later on this page.
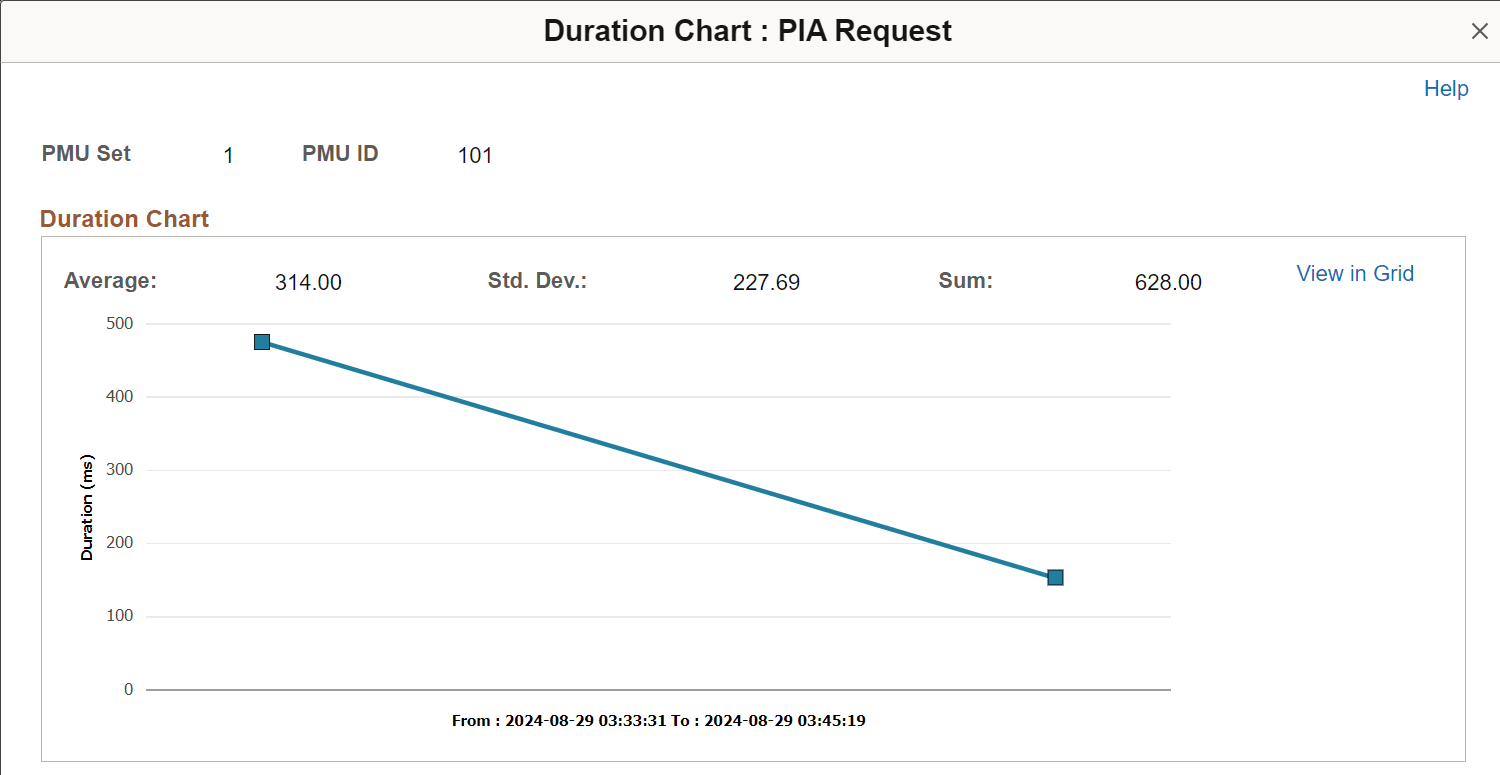
Use the View in Grid link to view the chart information in a grid so that you can download the information to an Microsoft Excel spreadsheet if needed.
Note:
To view the duration chart, you must specify a PMU and PMU set ID as part of the search criteria. If you click this link when performance data for multiple PMUs appears, the system displays an error message.