Working with Event History Information
The Completed Events section contains the results of your event history search.
Note:
If a "clone table" warning appears at the top of the page, the archive program is either currently running or has abnormally terminated. If this is the case, all new incoming information that is being sent to the monitoring system is currently being inserted into the clone tables. New performance data is not inserted into the current data tables until the archive program finishes successfully.
See Scheduling Performance Data Archiving.
Summary
The Summary tab displays the name of the event as well as the monitor date and time and agent date and time.
The maximum number of rows that are returned by the search is determined by the Search Row Limit on the Global Administration page.
See Setting Global System Options.
| Field or Control | Description |
|---|---|
|
Event |
Displays the name of the event reported. Click the event name to view the Event Details page, which provides:
|
|
Monitor Date/Time |
The date and time that the monitoring system inserted the row of performance data into the monitoring database according to the database clock. |
|
Agent Date/Time |
The date and time according to the agent clock that the domain monitor used when it last sent performance data to the monitor. Note: The date and the time appearing on this page always applies to the system on which the agent runs. Keep this in mind if you are monitoring systems in other time zones. |
Identifiers
The Identifiers tab displays information to help further identify the event and a particular event's origin.
| Field or Control | Description |
|---|---|
|
Event Set |
The event definition set to which the event definition belongs. |
|
Event ID |
The ID for a particular event definition, such as 300 for Host Resource Status. |
|
PID |
The operating system process ID of the process that generated the PMU. |
|
Agent ID |
The ID of the specific agent sending the event information. |
|
Domain Name |
The name of the domain in which the agent operates. |
|
Instance |
The system-generated identifier for a specific row of event information. |
|
Filter Level |
The filter level that is associated with an event definition. |
|
Description |
If applicable according to the event definition, a description appears to place the event in context. For example, with the Event 301 (Tuxedo "pq" Row) the description contains the name of the server process that is associated with a particular queue, such as PSAPPSRV, JSL, PSSAMSRV, and so on. The information corresponds to the Additional Data attribute that is part of the event definition. It stores data that exceeds the 128–character limitation of Metric 7. |
Metrics
The Metrics tab displays the metric values of the event definition for a specific reported event. Only metrics that are specified in an event definition contain values. For example, event 300 (Host Resource Status) does not assign values to metric 6 or 7; therefore, those metrics appear on the Metrics page as 0.0000.
Metric information appears in raw form.
See Metric Definitions.
Metric Charts
The system creates a metric chart only when you have selected a single event in the search criteria. The metrics that appear in the charts vary depending on the event definition.
This example illustrates the fields and controls on the Viewing an event metric chart. You can find definitions for the fields and controls later on this page.
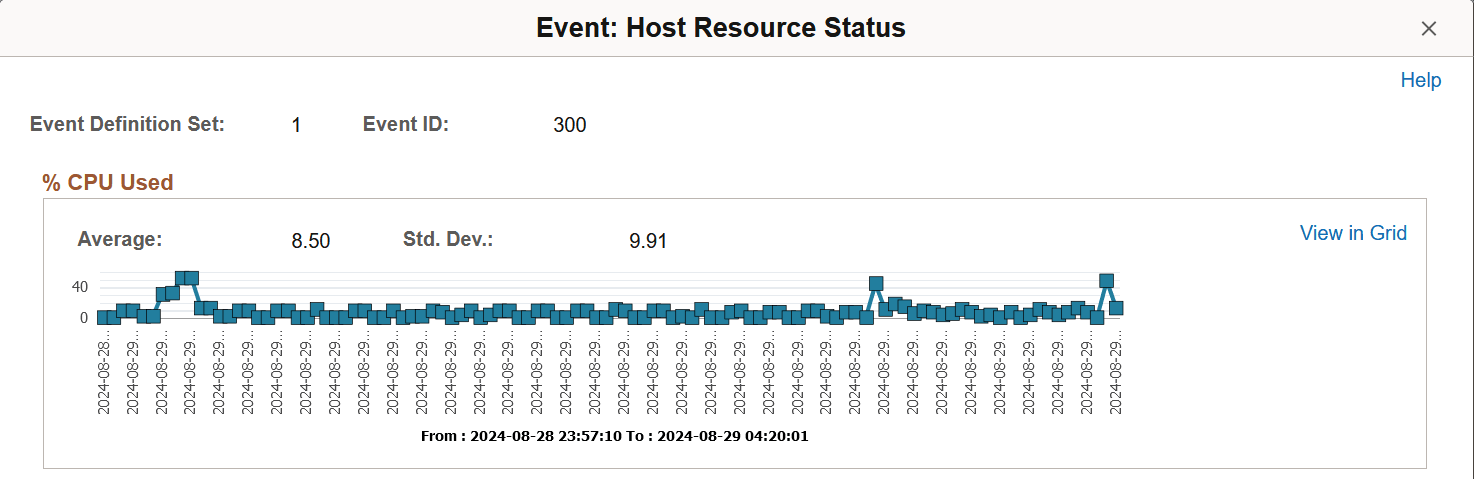
Note:
%CPU Used is only one of the charts that appear in the metric charts for Host Resource Status.