Displaying Thresholds in Pivot Grid Views
The following sections display how thresholds appear in pivot grid views.
Threshold Type Distinct on Chart View
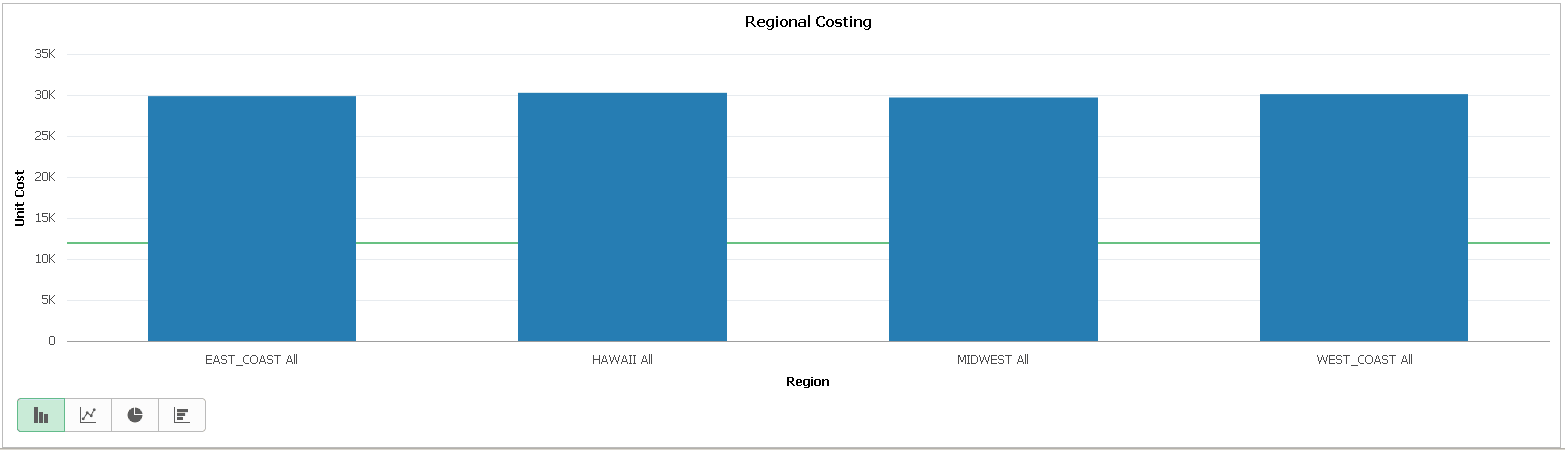
This example shows the thresholds for the Unit Cost column in a Pivot Grid chart. The threshold type is set to Distinct, the color is set to green, and the value is set to 12000.
Threshold Type Range on Chart View
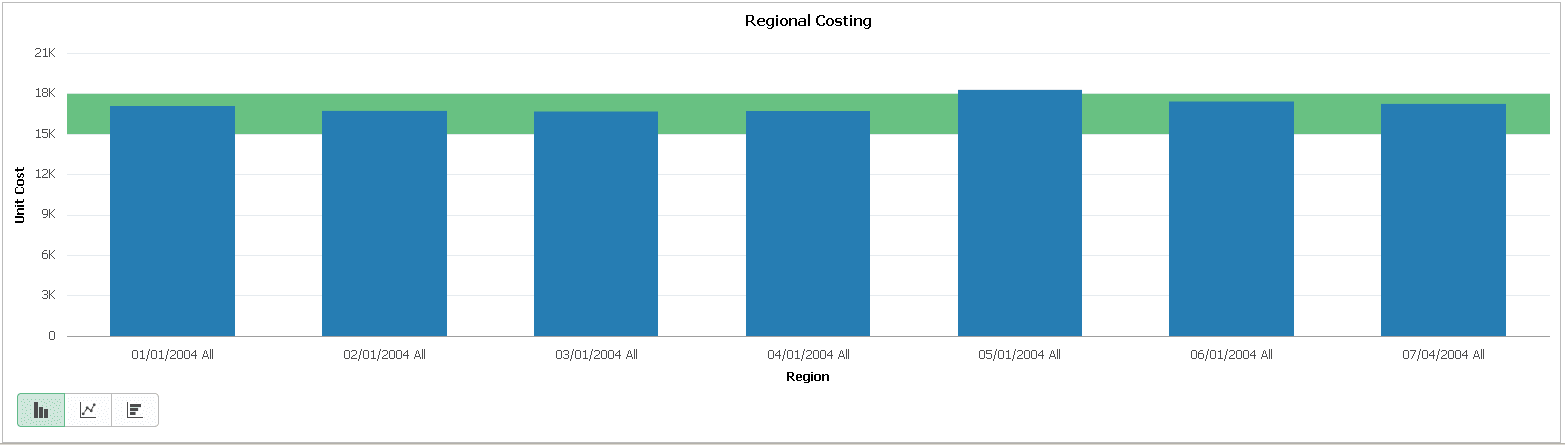
This example shows the thresholds for the Unit Cost column in a Pivot Grid chart. The threshold type is set to Range, the lower limit is set to 15000, the higher limit is set to 18000, and the color is set to green.
Displaying Thresholds for Individual Data Points - Block Representation
Note:
Block representation of thresholds for individual data points is only available in the Pivot Grid Viewer for Chart only views in Fluid mode.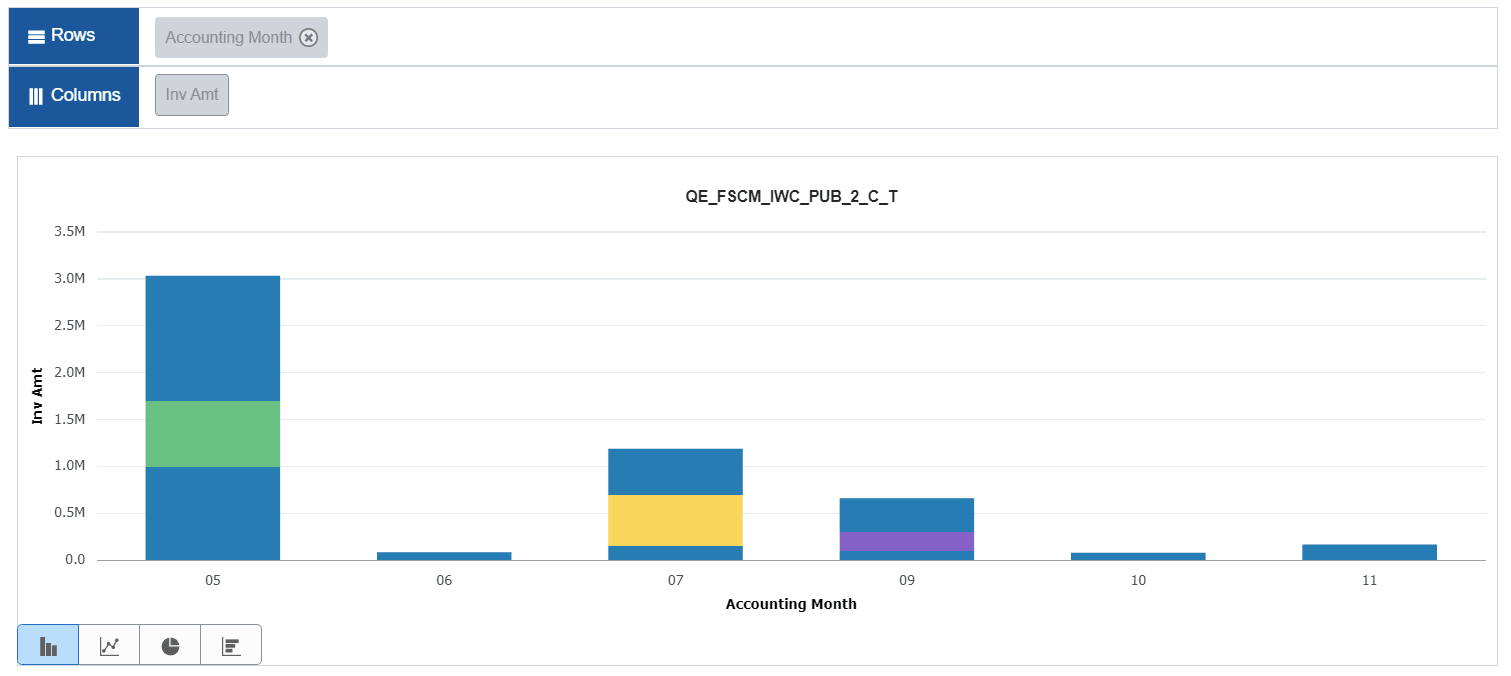
Displaying Thresholds for Individual Data Points - Gradient Representation
Note:
Gradient representation of thresholds for individual data points is only available in the Pivot Grid Viewer for Chart only views in Fluid mode.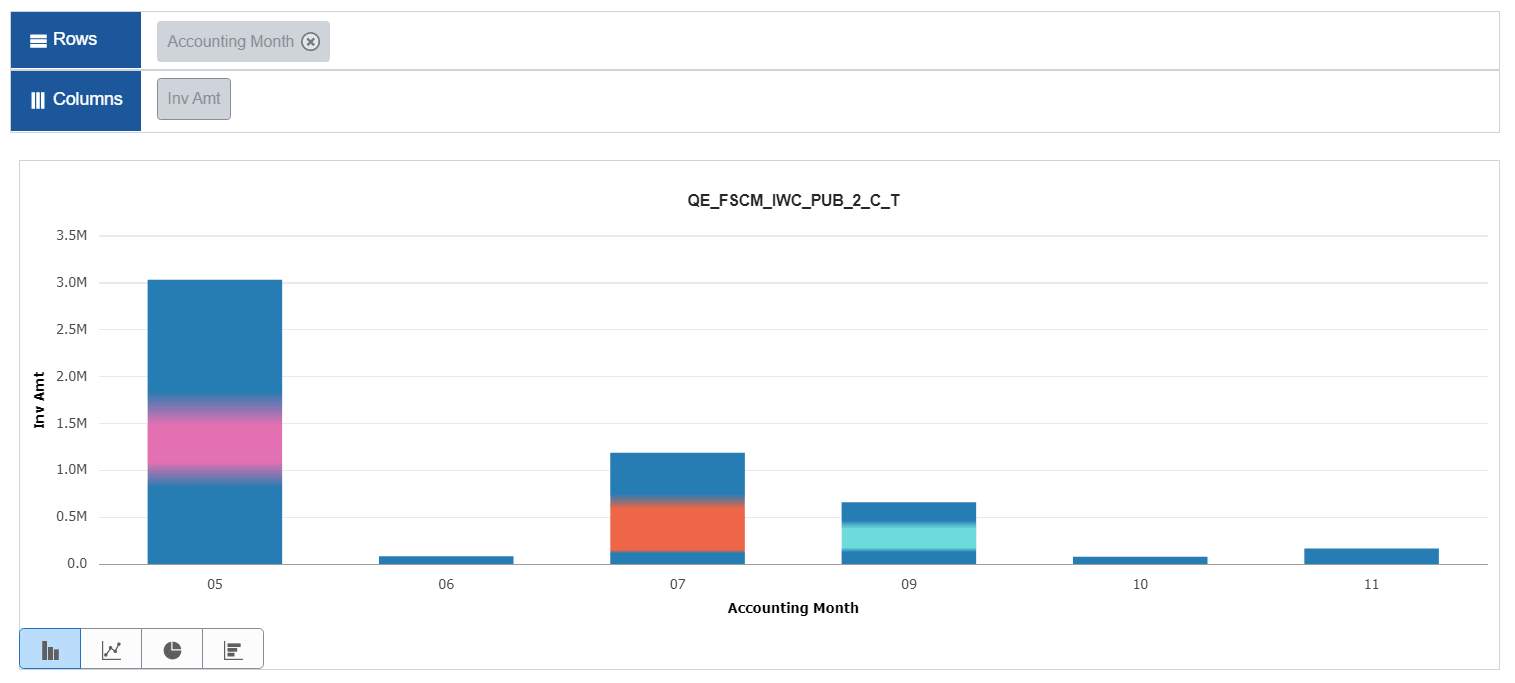
Displaying Thresholds for a Dual Y-Axis
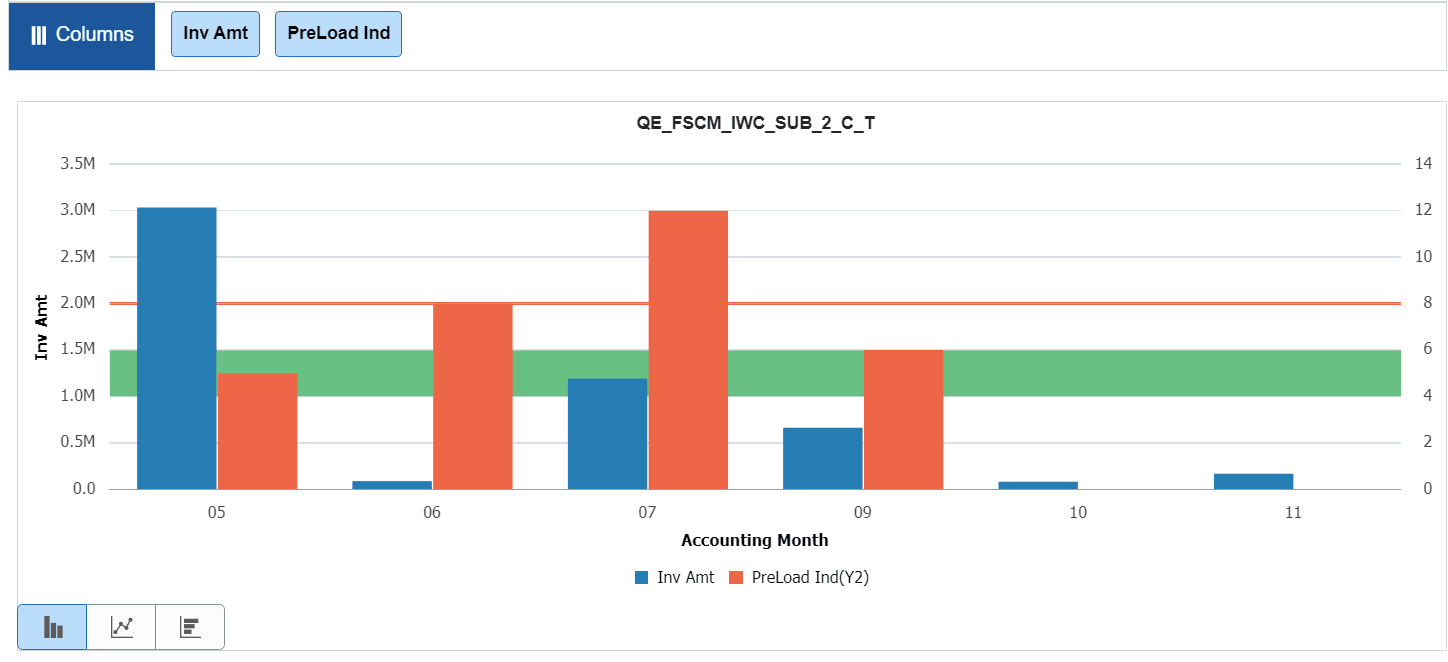
This example shows thresholds for the Inv Amt column and the PreLoad Ind column in a Pivot Grid chart. The threshold type for Inv Amt is set to Distinct, the threshold value is set to 2000000, and the color is set to red. The threshold type for PreLoad Ind is set to Range. The lower limit is set to 4, the higher limit is set to 6, and the color is set to green.
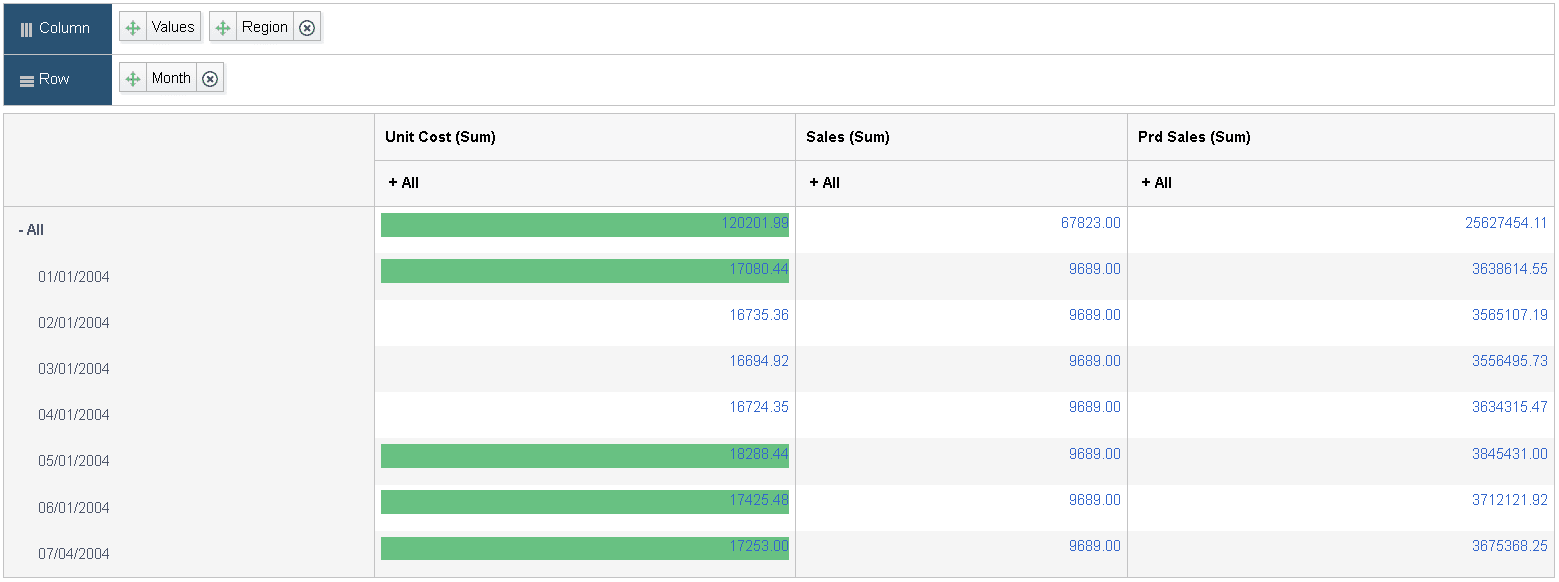
Threshold Type Set to Distinct in Grid View
This example shows the thresholds for the Unit Cost column in a pivot grid. The threshold type is set to Distinct, the value is set to 12000, and the color is set to green. Note that all the facts that are plotted on the grid can have thresholds configured.