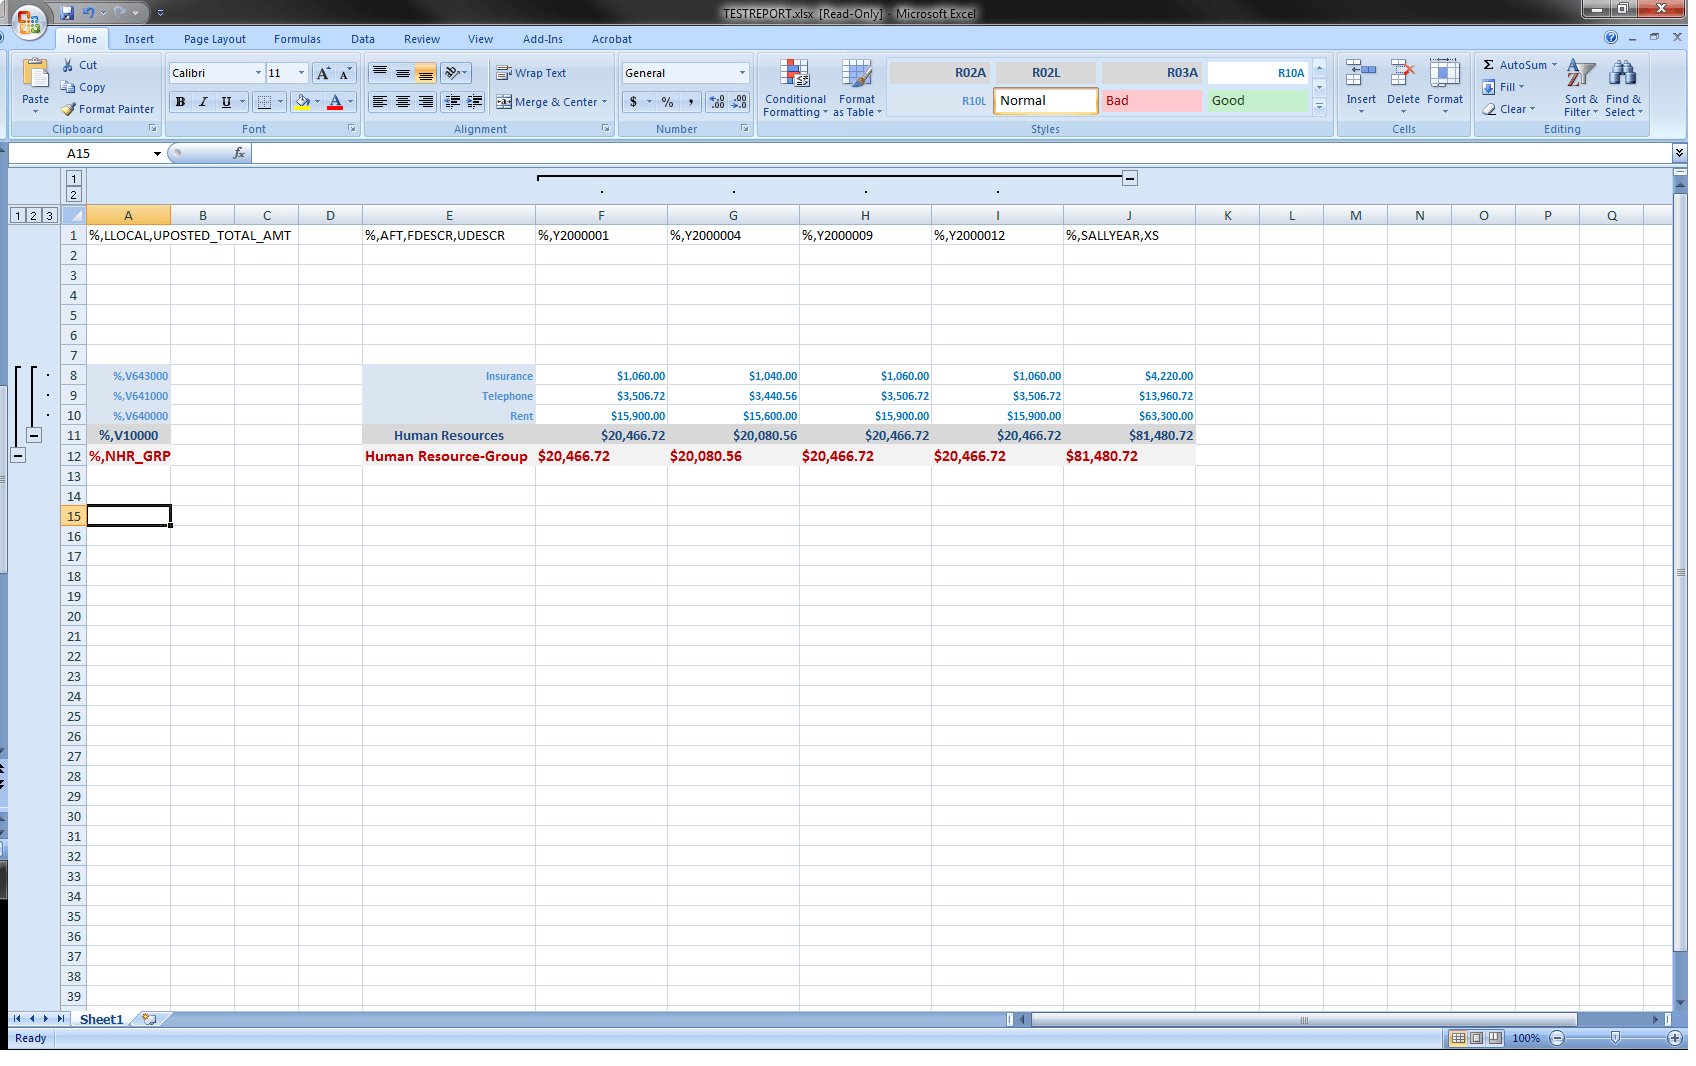
Defining Multiple Chart-field nPlosion
This example illustrates how to define Multiple Chart-field nPlosion using the existing functionality in nVision:
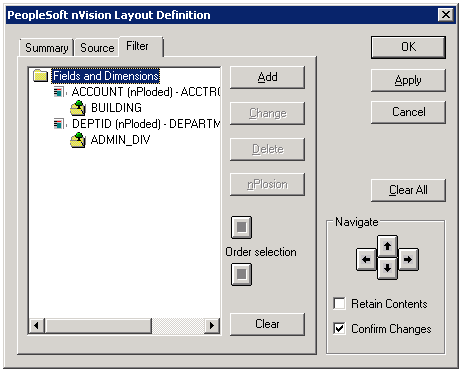
This example illustrates the fields and controls on the multiple chart-field nPlosion Layout window:
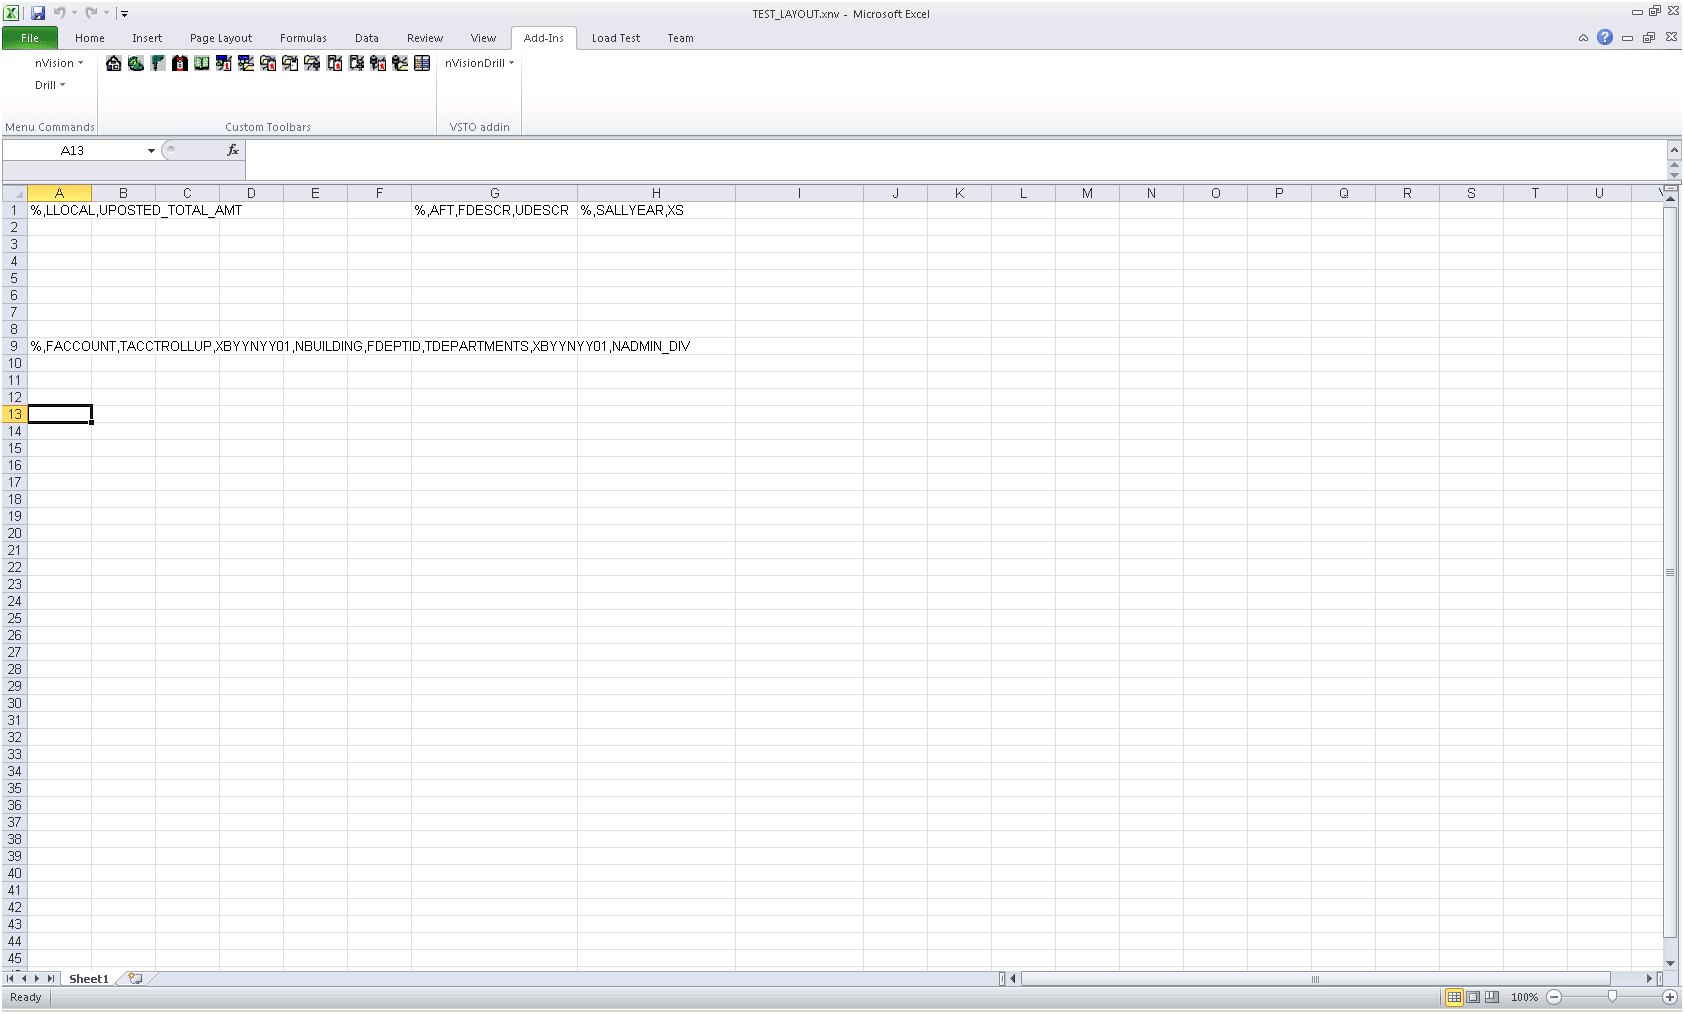
To define Multiple Chart-field nPlosion in nVision:
-
Open any existing layout or create a new one.
-
Select from the menu.
-
In the PeopleSoft nVision Layout Definition dialog box, select the cells to which you want to apply multiple chart-field nPlosion.
-
Select the Filter tab.
-
Click the Add button to add the chartfield.
-
Select the chart-field and then select the tree.
-
Add the node for which nPlosion is required.
-
Repeat steps 6 through 8 to add subsequent chart-fields.
-
Click OK.
This example illustrates the fields and controls on the multiple chart-field nPlosion Style Wizard window: