Verify
Description
Compares the value in the browser to the expected value, and adds a pass or fail log entry for the validation.
When you drag the Verify icon and drop it on a chart on the browser page, the chart is highlighted and the Chart.Verify dialog box opens.
Chart.Verify dialog box appears where you enter the required properties of the chart.
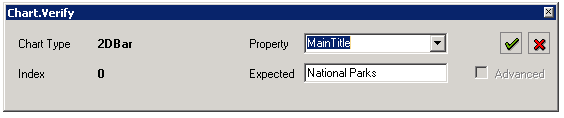
| Parameter | Description |
|---|---|
|
Chart Type |
Populated from the HTML tag. |
|
Index |
Populated from the HTML tag. It is the index value of a chart object when there are more than one chart on the same page. |
|
Property |
Select from the available properties for a particular Chart Type. |
|
Expected |
Displays the value to be verified which depends on the Property field. It is populated when a property is selected. The field in some instances may remain blank if there is no value to be verified. |
Example
The table illustrates the Verify action for Chart step type.
| Type | Action | Recognition | Parameters | Value |
|---|---|---|---|---|
|
Chart |
Verify |
chart=2DBar |
idx=0;prop=ReferenceArea(1).Description |
Reference Area2 |
|
Chart |
Verify |
chart=2DBar |
idx=0;prop=DateSeries(1) |
GLACIER |
Related Topics