Add Dashboard Filters
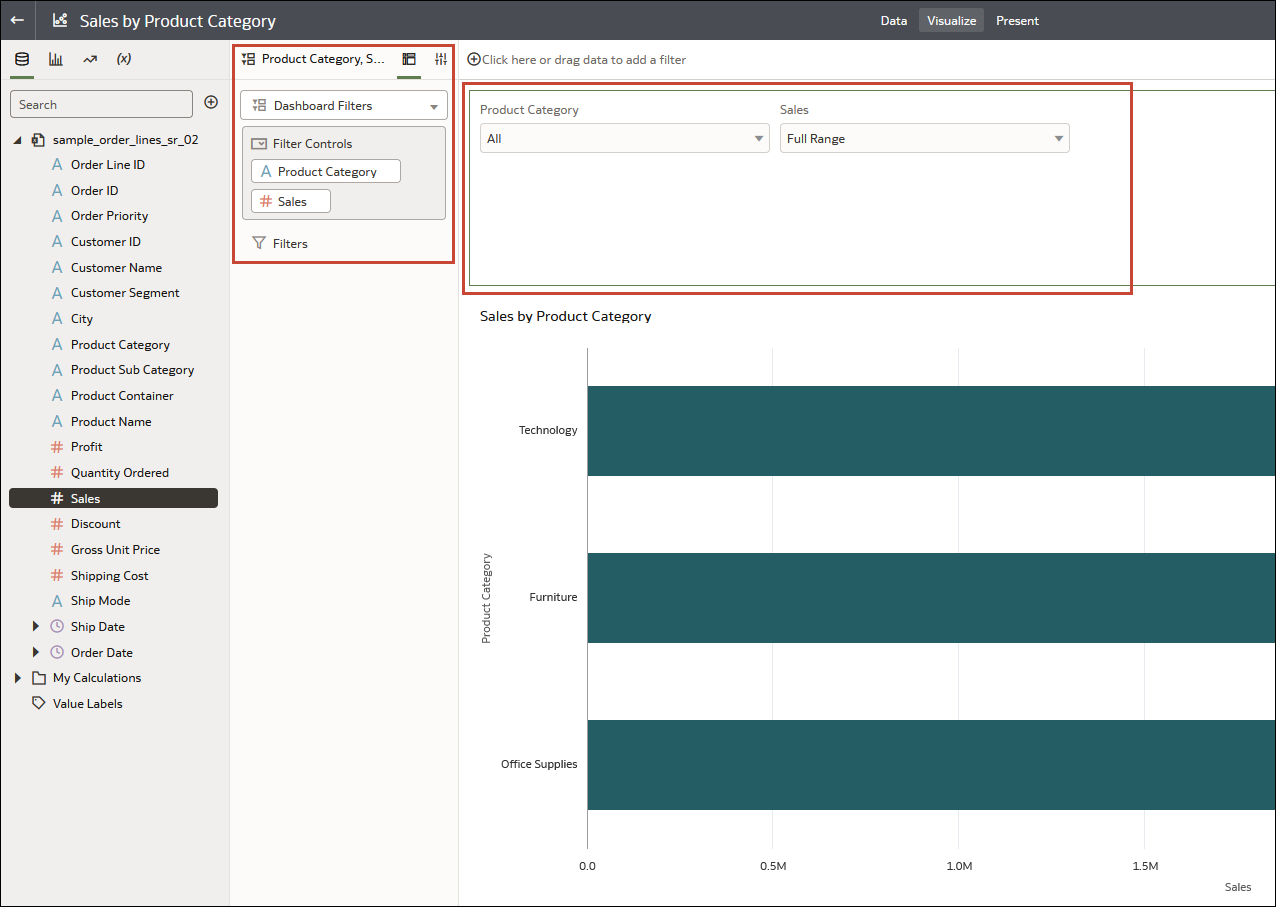
Use the Dashboard Filters visualization to create and configure your dashboard filters.
Dashboard filters enable consumers to select their own filter values to change the data in the visualizations.
For information about the different types of filters you can use, see Filter Types.
For information about dashboard filter properties, see Filter Properties.
For information about adding a selection step to a dashboard filter, see Use Selection Steps in a Workbook.
- On your home page, hover over a workbook, click Actions, and select Open.
- In the Visualizations Panel, click Visualizations, scroll to Dashboard Controls, and drag Dashboard Filters to the canvas.
- Create a dashboard filter control using a column or a parameter.
- In the Data Panel, click Data and drag a column to the new dashboard filters visualization.
- In the Data Panel, click Parameters and drag a parameter to the new dashboard filters visualization.
- In the Data Panel, click Data and drag a column to the new dashboard filters visualization.
- Optional: Click the filter control to open the Filter dialog, then select the data values filter on.
- Click Save.