Bind a Parameter to a Reference Line or Band
You can bind a parameter to a reference line value or a reference band range in a visualization when you want to use a parameter value to place the reference line or band on the visualization.
When you bind a parameter to a reference line or band, you can add the same parameter as a filter so that a user can select a value or range to control the placement of a visualization's reference line or band.
For example, you can bind a parameter to a reference line based on Ship Date for a visualization that shows Sales by Ship Date. You can then use that parameter as a filter and move the Ship Date reference line on the visualization based on your parameter value selection.
You can only bind a parameter to a reference line value or reference band range that uses an attribute, date, or derived date column.
When you bind a parameter to a reference line, you can either create a new parameter with the same name as the reference line column, or you can choose an existing parameter. If you create a new parameter, it's added to the Parameters pane and you can edit it there.
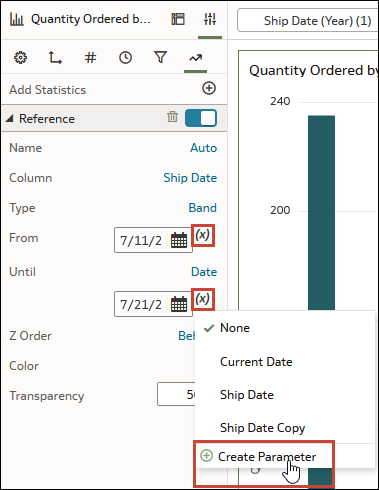
Because reference bands have a range, you can bind parameters to both the From property and the Until property. If you create a new parameter for both, the parameters both have the same name as the column used for the reference band.
For information about creating a reference line, see Add a Reference Line to a Visualization. For information about using a parameter as a filter, see Ways to Use Parameters with Filters.
- On your home page, hover over a workbook, click Actions, then select Open.
- Click the visualization with the reference line or band to select it.
- Click Properties, then click Analytics.
- Expand Reference.
- For a reference line, in the Value field, click (x) Bind to Parameter, then click Create Parameter.
- For a reference band, in the From and Until fields, click (x) Bind to Parameter, then click Create Parameter.
- Click Save.
