Enrich and Transform Your Data

Before you deploy your visualization workbooks, you typically enrich and transform your data. For example, you might rename data columns, fix cell phone data, or add calculations.

  1. On the Home page, open a dataset or workbook.
    • Hover over the dataset, click Actions (Actions menu ellipsis icon), and then select Open. In the Data Diagram or Join Diagram, right-click a data source and click Open to display the transform editor.
    • Hover over the workbook that contains the dataset, click Actions (Actions menu ellipsis icon), then select Open, then click Data. In the Data Diagram or Join Diagram, right-click a data source and click Open to display the transform editor.

    Note:

    Oracle Analytics displays a Data Diagram for single-table datasets or a Join Diagram for multi-table datasets.
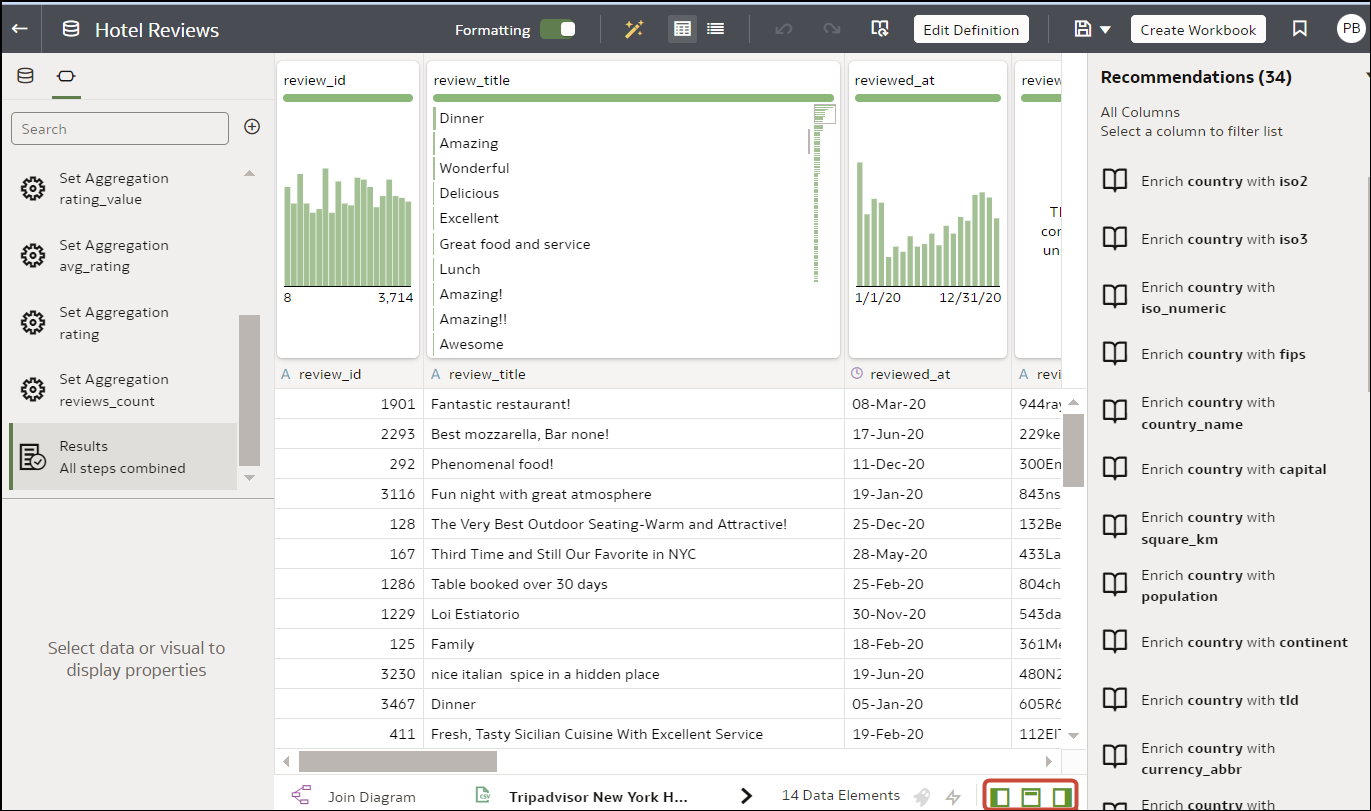
  2. Select columns and use the enrich and transform tools to enhance your data.
    • Use the Recommendations panel to apply suggested enrichments and transformations.
    • Use the Options menu at the top of each column to apply common transformations such as Rename, Uppercase, and Trim.
    • From the Options menu at the top of a column, click Edit to enhance columns with functions and expressions from the Oracle Analytics functions library. For example, aggregates, strings, expressions, and math functions.
    • Click Add Preparation Step in the Data Panel to add a column based on a custom transformation. You can build your column using a wide range of functions and expressions from the Oracle Analytics functions library. For example, aggregates, strings, expressions, and math functions.
    • Use the properties pane at the bottom of the Data Panel to review and change a column's type and aggregation. For example, you might select Treat As and change from attribute to measure, or change the default Aggregation type from Sum to Average.
    • Use the Quality Insights tile above each column to explore and enrich your data.
    When you edit data, a step is automatically added to the Preparation Script pane. A blue dot indicates that a step hasn't been applied.
  3. To save your data preparation changes and apply them to your data, click Save Dataset.
  4. If you're working in a workbook, click Save and click Visualize to review the enriched columns.
Note: It's best to configure your transform editor by displaying the Data Panel, Recommendations Panel, and Quality Insights. Use these toggle options displayed bottom right Toggle Data Panel , Toggle Column Action Panel , and Toggle Quality Insights.