Filter Data in a Workbook
Use filters in a workbook to focus in on the data that you're interested in. For example, you might filter by Month and visualize data only for January, February, and March.
You can apply filters to one visualization, all visualizations in a canvas, or all canvases in a workbook.
- On the Home page, hover over a workbook, click Actions, select Open, then click Edit.
- Navigate to a canvas, and display the Visualize pane.
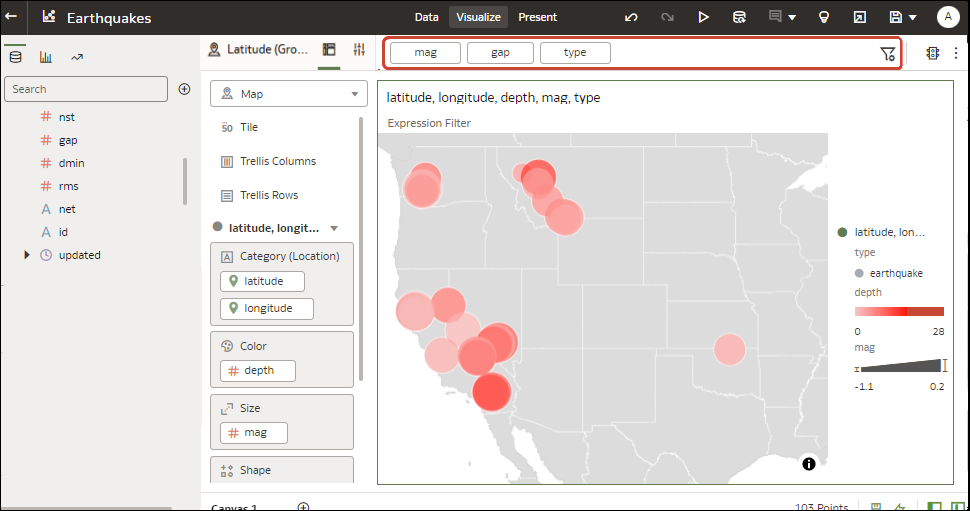
- Use the filter bar to update existing filters.
- To change the default filter options, click the Filter Bar Menu icon on the filter bar (
 ), and use the options displayed.
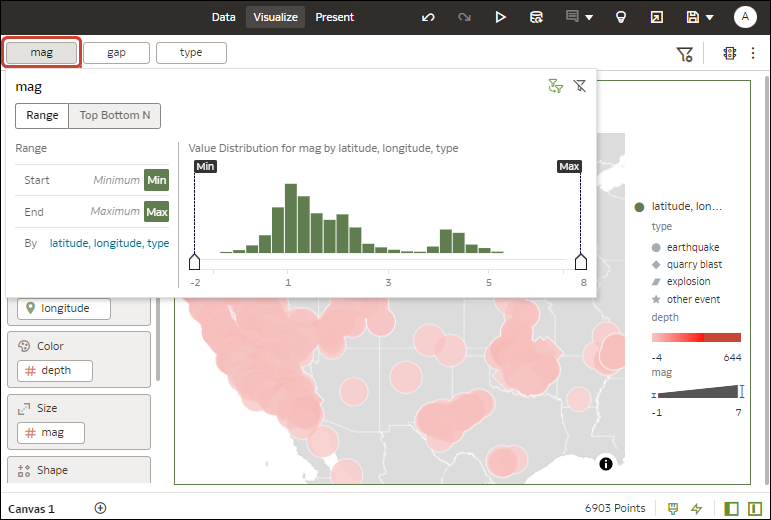
- To change an existing filter, click the filter on the filter bar.
Use the options to configure that filter (for example, you might set the range, or disable the filter).
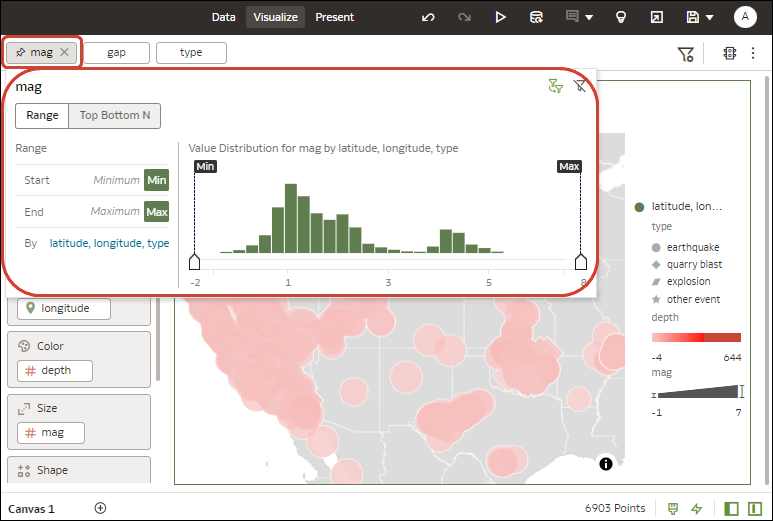
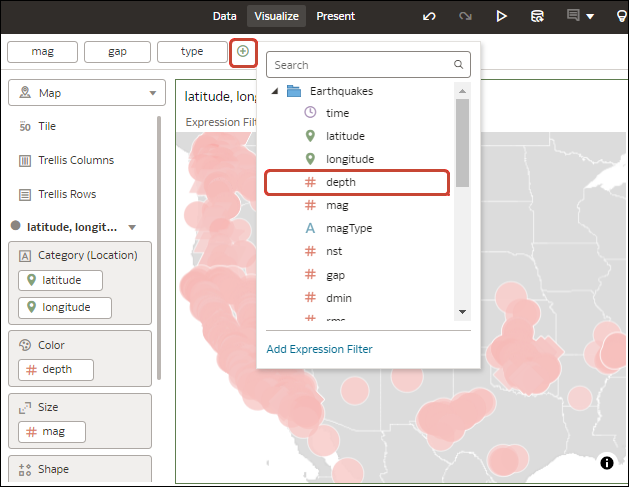
Description of the illustration filter-menu-options.png - To add a filter, hover over the filter bar, click Add Filter (+), and select a data element to filter.
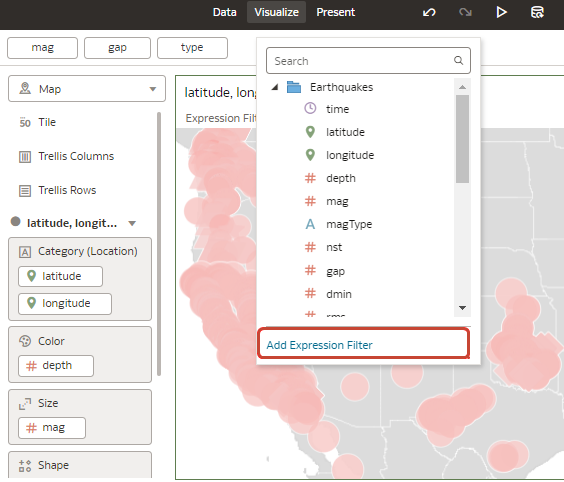
- To add a complex filter using an expression (for example, field1 + field 2 > 100), hover over the filter bar, click Add Filter (+), then click Add Expression Filter.
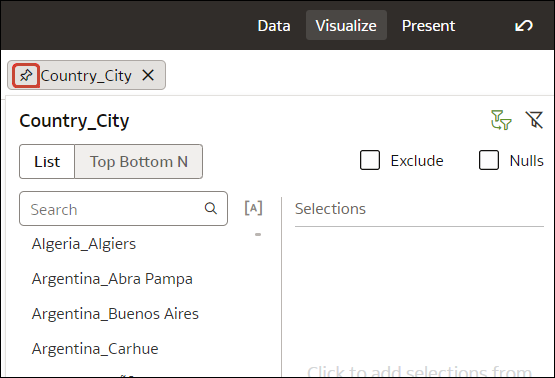
- To apply a filter to all canvases in a workbook, hover over the filter, and click Pin to All Canvases (the Pin icon).
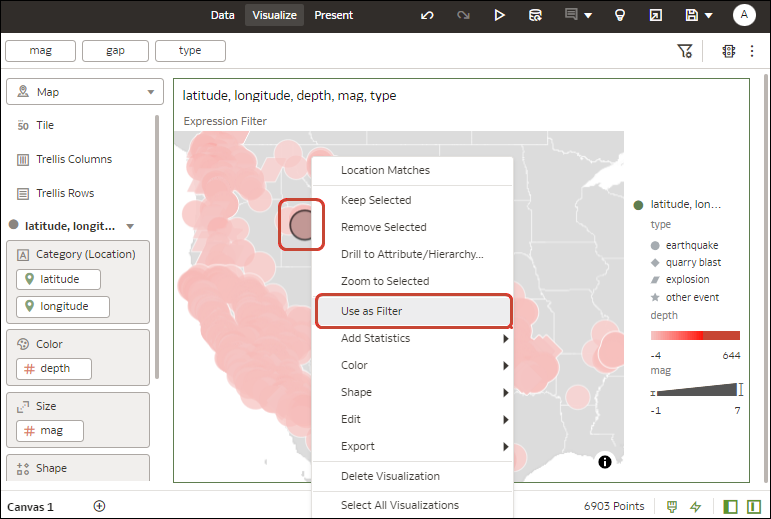
- To filter on a visualization element, right-click the element and select Use as Filter.
The Use as Filter icon turns green when activated.

