About Trellising Visualizations
You can trellis a visualization to compare groups of data in separate chart panels.
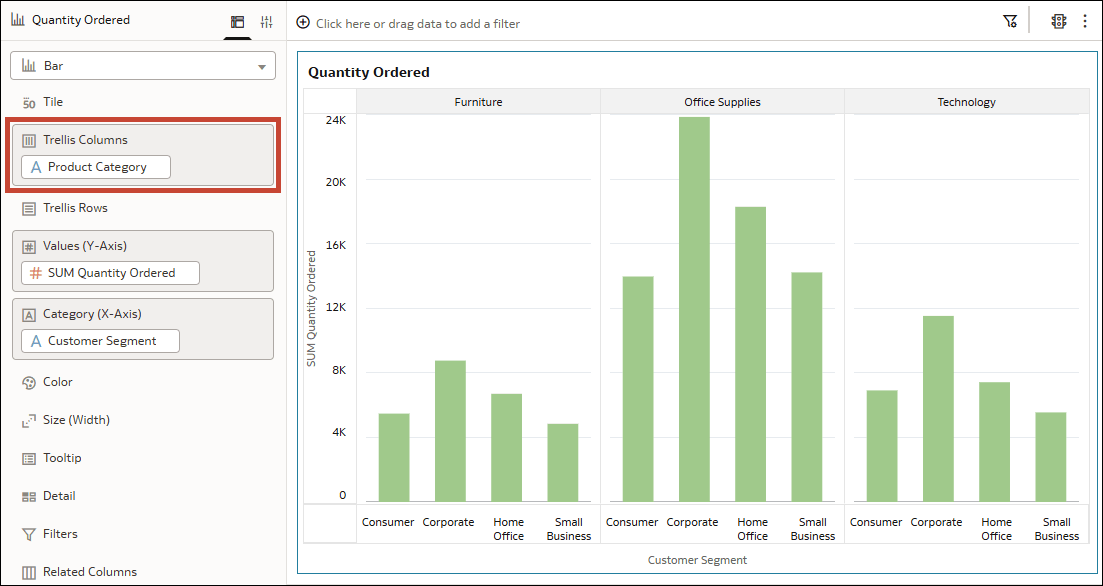
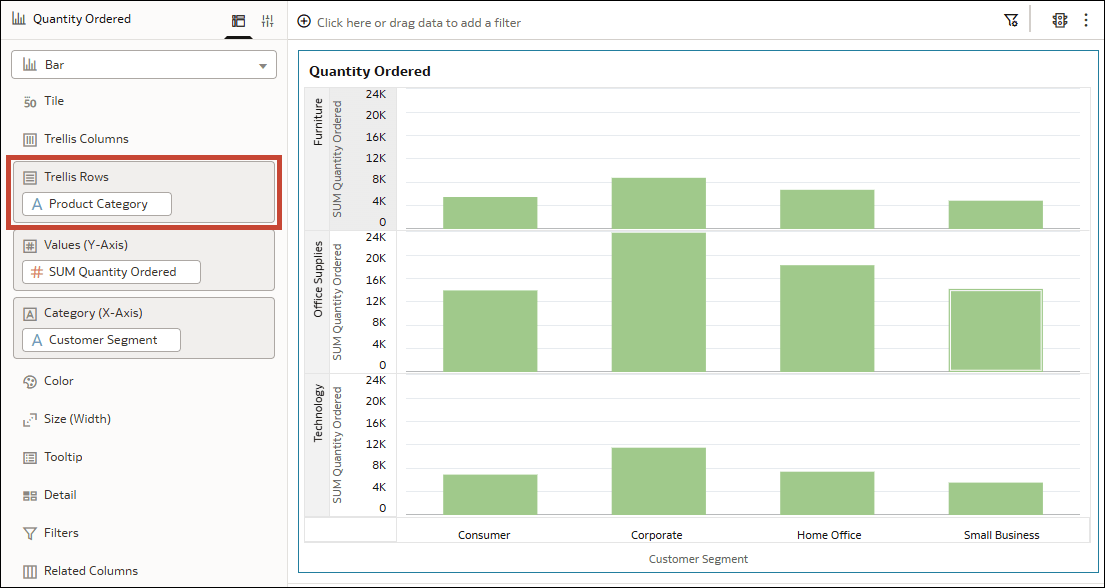
A trellis divides a visualization into smaller charts based on the values in an attribute column. Each panel displays the data for a different attribute value. Add an attribute column to Trellis Columns in the Grammar pane to arrange the panels side by side, or to Trellis Rows to arrange them vertically.
For example, suppose you have a bar visualization showing Quantity Ordered by Customer Segment. If you add Product Category to a trellis drop target, the visualization displays separate panels for Furniture, Office Supplies, and Technology. Each panel shows the quantities ordered by the Consumer, Corporate, Home Office, and Small Business customer segments.
You can use a shared values axis range to compare quantities across panels, or scale each panel independently to examine differences within each group. See Set the Axis Scale Scope for a Trellised Visualization.