Tune Performance with Excluded Columns
It's quite common for analyses to contain unused columns. Columns that aren't required but are still selected significantly impact performance. This topic explains how to improve performance by removing any column that isn't required.
Identify Unused Columns
Year), you impact performance by:
- Increasing the volume of data that needs to be retrieved from the database
- Increasing the number of columns to be retrieved and processed
- Forcing the analysis to compute results at multiple levels of aggregation
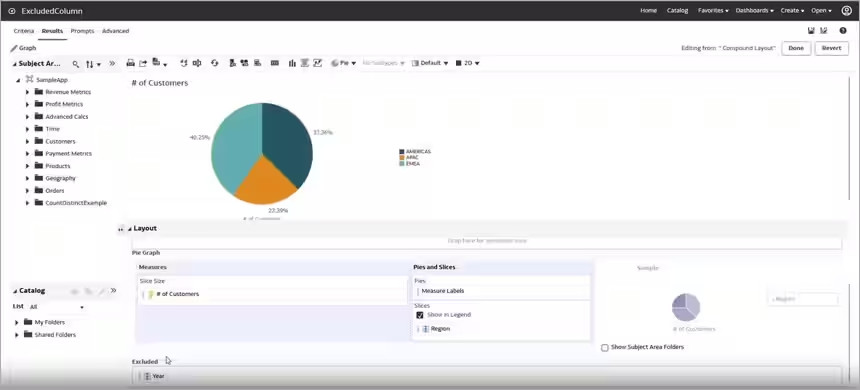
The following figure shows a simple report with the number of customers by region and year.

Description of the illustration ceal_report_customers_by_region_year.jpg
The report that's displayed is a graph showing the number of customers by region. You can see that the Year column is excluded.

Description of the illustration ceal_report_graph_customers_by_region.jpg
Logical Query with Unused Year Column
Even though the Year column isn't displayed in the view, it's still selected as part of the logical query.

Description of the illustration ceal_logical_query_includes_year.jpg
Year column in the analysis has the following impact:
- Additional columns are retrieved and processed.
- Additional rows are retrieved and processed, because the number of customer rows is selected not only by region, but also by year.
- Further aggregation is required.
Physical Query with Unused Year Column
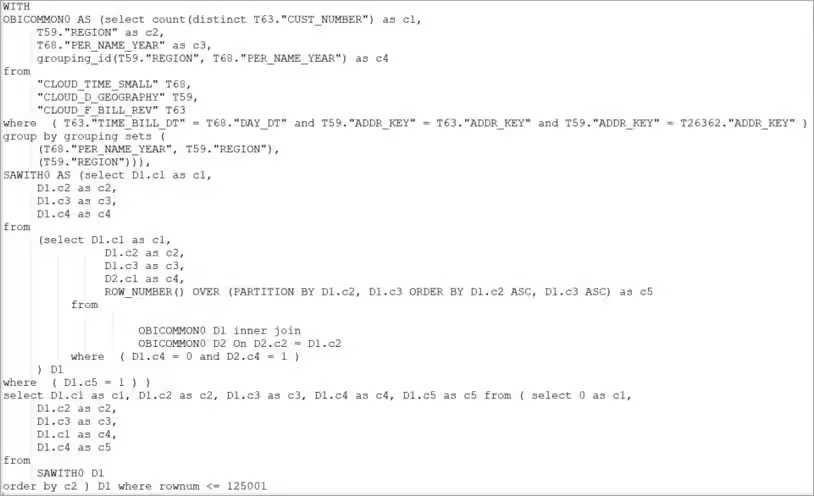
If you review the physical query, you can identify areas where performance is impacted.

Description of the illustration ceal_-physical_query_performance_impact.jpg
This example shows SELECT count distinct from the customer number aggregation rule. In some situations, it also impacts reports with a sum aggregation rule. The generated query in this scenario also uses a grouping set. At the database level, it might be selecting many rows (millions) and then having to group by Year and Region, as well as Region. This can consume significant, unnecessary database resources.
Remove Unused Columns
Remove the Year column and analyze the impact on the logical and physical queries that are generated.
Logical Query After Year Column Removed
Now, the logical query doesn't contain the Year column and, more importantly, the report aggregation is removed.

Description of the illustration ceal_logical_query_no_year_or_report_agg.jpg
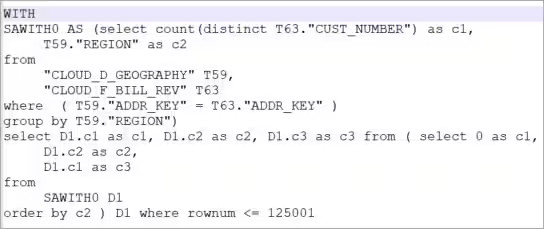
Physical Query After Year Column Removed
The physical query is much simpler now that it doesn't include grouping sets, and the number of records selected is greatly reduced.

Description of the illustration ceal_physical_query_no_grouping.jpg
By reviewing the analysis of non-performant reports, and in the first instance, simply removing redundant unused columns, you can achieve significant performance gains. The physical query generated has reduced complexity and fewer records are returned, therefore less processing is required.