About Using the Oracle Analytics AI Assistant as a Consumer
As a consumer user, you can use the Oracle Analytics AI Assistant in workbooks where it has been enabled by the author.
The Oracle Analytics AI Assistant is an AI-powered tool you can prompt with natural language to analyze indexed data.
The workbook author determines which datasets and subject areas are available to the Assistant.
Ask Questions and Explore Responses
You can access the AI Assistant from the Assistant tab in the Insights Panel  .
You can ask about the information you want to understand, such as “Show me sales” or “Profits by city”. You can also ask follow-up questions to refine the results. For example, after asking “Profits by city”, you might ask “Only show me cities in Europe”.
If the workbook author has enabled a data agent, the welcome message in the AI Assistant may provide specific instructions or additional details for you.
View and Manage the Conversation
- Clear Assistant History
 : Lets you reset the context and start a new conversation.
- Enlarge Drawer
 : Lets you enlarge the Insights panel.
Refine a Visualization
The AI Assistant typically responds to questions with a table visualization and offers a few other simple visualizations as alternatives that you can browse through. The controls below the AI Assistant's response help you change how the results are displayed or which fields they contain. A field is a column of data, such as Total Sales or Total Profit.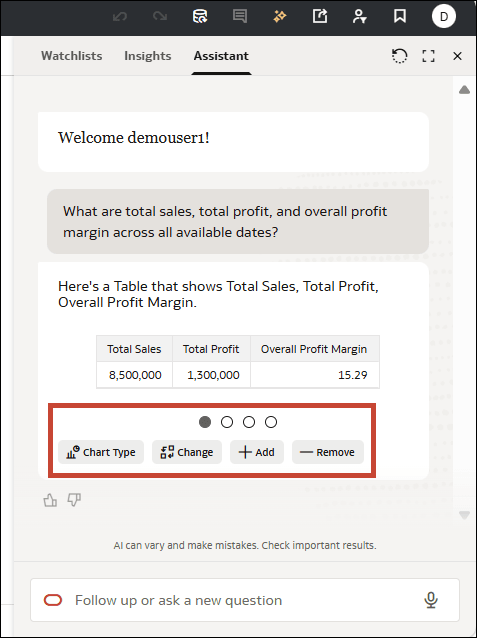
Description of the illustration ai_assistant_example.png
| Control | Description |
|---|---|
| Chart type |
Lets you select a different visualization type from a list and generate a new response using that type. |
| Change |
Lets you replace a field with another field and re-generates the visualization. |
| Add |
Lets you add another field or a filter and re-generates the visualization. |
| Remove |
Lets you remove a field and re-generates the visualization without it. |