 Analyzing Employee Recruitment Data in Oracle Analytics Cloud
 Before You Begin
This 5-minute tutorial shows you how to create visualizations to analyze human resources attrition and develop insights that might lead to a solution.
Background
In this tutorial, you analyze employee recruiting data with employee performance ratings, and resignation reasons to determine if recruiting efforts have an impact on why employees leave the company.
What Do You Need?
- Access to Oracle Analytics Cloud or Oracle Analytics Desktop
- Access to the HR Attrition project
- Download taleo_recruitjw.xlsx to your computer
 Add Recruiting Data
- Sign in to Oracle Analytics or Oracle Analytics Desktop.
- On the Home page, enter HR Attrition in the Search bar, and click Search.
- In the HR Attrition project, select the Action Menu, and then select Open.
- In the Data Elements pane, click Add
 , and then click Add Data Set.
 - In Add Data Set, click Create Data Set. In Create Data Set, click Drop data file here or click to browse, select the
taleo_recruitjw.xlsxfile, and then click Open. - Use the scroll bar to look over the columns in the data source. Wait for the loading data indicator to stop, and then click Add.
- To see the connections between the data sets, click Prepare, click Data Diagram, and then click the 1 between the taleo_recruitjw data set and the terminations_workers_details data set.
The data sets are connected on the Employee ID column. Employee ID also serves as the connection between the taleo_pay_perfjw and taleo_recruitjw data sets.

Description of the illustration connect_empid.jpg
 Analyze the Data
- Click Visualize. Click the Employee Performance canvas menu
 , and then select Duplicate Canvas.
 - On the Employee Performance Copy tab, click menu , and then select Rename. Enter
Recruitment Analysis. Click Save. - In the Recruitment Analysis canvas, click the # of Terminations by Job Level visualization, select Termination Reason in the Color box, and then click X.
- Expand the taleo_recruitjw data set, drag Recruiter to the Category (Y-Axis) box in the Grammar panel replacing Job Level in both visualizations.
- In the # of Terminations by Recruiter visualization, select Menu
 , select Sort, and then select Recruiter by # of terminations High to Low.
 - In the horizontal bar visualization, click RecruitUSA.

Description of the illustration terms_by_recruiter.jpg - In the # of Terminations by Recruiter visualization, select Internal to compare the employee performance and terminations by recruiter in both visualizations. Click Save.
 Create an Insight About Recruiter Terminations
- Click Narrate. From Canvases, drag Recruitment Analysis to Drag a Canvas Here to Begin.
- In the Recruitment Analysis canvas, click menu , and then select Rename Page. In the page title, enter
Recruiter Problem. - Click Add Note
 . In Note, enter
 Most high-risk employees come from one recruiter - RecruitUSA. Click Save.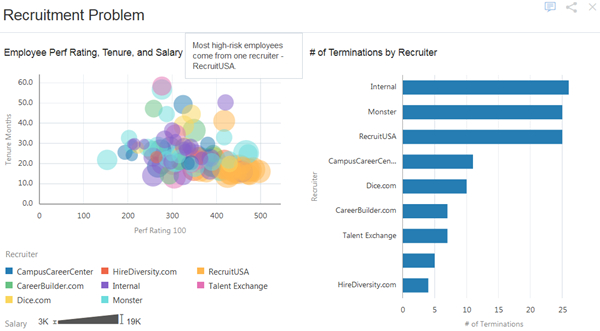
Description of the illustration recruitment_problem.jpg - (Optional) Click Present. Click the X in the upper right-hand corner to close Present and return to Narrate.