Before You Begin
This tutorial shows you how to define data actions and create links in a table visualization that navigate to another canvas in an Oracle Analytics workbook.
Background
You can define data action analytics links to navigate to a canvas in the same or different workbook. This tutorial shows you how to create data action links in a table or pivot visualization to another canvas in the workbook.
The target canvas opens in a pop up on the canvas when a user clicks the data action analytics link. When the analytics link data action is invoked, the context of the source canvas passes to the target canvas. You test the data action analytics links in the last section of this tutorial.
What Do You Need?
- Access to Oracle Analytics
- Download the detailed_sales.dva
Import a Workbook File
In this section, you import and open the sample workbook.
- Sign in to Oracle Analytics.
- On the Home page, click Page Menu and select Import Workbook/Flow.
- In Import Workbook/Flow, click Select File. In File Upload, select detailed_sales.dva, click Open, and then click Import.
- In the Import successful message, click OK.
- On the Home page, hover over detailed_sales, click Actions
 and select Open.
Add a Canvas and Visualization
In this section, you add a canvas to the workbook and then create a table visualization.
- In the workbook, click Edit
 .
. - In the Visualize page, click Create Canvas
 . Click Canvas menu
  and select Rename.
 - In the canvas name field, enter
Product Salesand click the check .
. - Drag the Product Sales canvas to the left to make it the first canvas in the workbook.
- In the Data
 pane, hold down the Ctrl key, click Product Category, Product Sub Category, and Sales. Right-click, select Pick Visualization, and then click Table
  .
. - Click Properties
 . In Properties, click Auto in the Title row, select Custom, and then enter
 Product Salesin the title field. - In the Suppress Repeating Values row, click Off to enable On.
- In Properties, click Totals
 . In the Grand Total row, click Off to toggle On. In the Font row, click Auto. In Font, click B and click outside of the dialog.
 - In the Subtotal row, click None and click Product Category. Click Save
 .
.

Description of the illustration prod_sales_totals.png
Create a Data Action
In this section, you create a data action to connect Product Category column values on the Product Sales canvas to the Product Category details on the Detailed Sales Data canvas.
- In the workbook, click Menu and select Data Actions. In Data Actions, click Create Action .
- In New Data Action, enter
Details by Product Categoryin Name. In the Type list, select Analytics Link.
 - Click Select Data in the Anchor To row. From the Sample Order Lines dataset, select Product Category and click outside of the dialog.
- Keep This Workbook in the Target row. Click Product Sales in the Canvas Link row and select Detailed Sales Data.
- Keep All in the Pass Values row and keep On in Supports Multiple Selection.
- Click Auto in the Open In row and select Pop Up. Keep All in the Pass Parameter Values row and click OK.

Description of the illustration details_prodcat_data_action.png - In Properties, click Edge Labels
 . In Edge Labels, expand Product Category. Click Off in the On Click Action row to enable On for the data action links.
Description of the illustration prod_sales_prodcat_links.png - Click Save .
Create a Data Action for Product Sub Category Details
In this section, you create a data action to connect Product Sub Category values to the Detailed Sales Data canvas.
- In the workbook, click Menu and select Data Actions. In Data Actions, click Create Action .
- In New Data Action, enter
Details by Product Sub Categoryin Name. - In the Type list, select Analytics Link.
- Click Select Data in the Anchor To row. From the Sample Order Lines dataset, select Product Sub Category and click outside of the dialog.
- Keep This Workbook in the Target.
- Click Product Sales in the Canvas Link row and select Detailed Sales Data.
- Keep All in the Pass Values row and keep On in Supports Multiple Selection.
- Click Auto in the Open In row and select Pop Up. Keep All in the Pass Parameter Values row and click OK.
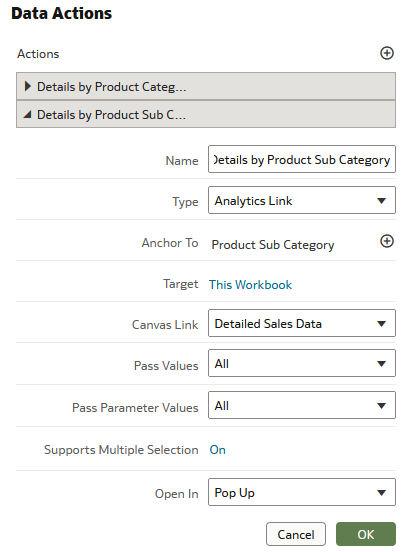
Description of the illustration data_action_prodsubcat.png - In Properties, click Edge Labels . In Edge Labels, expand Product Sub Category, click Off in the On Click Action row to enable On for the data action links.

Description of the illustration prodsubcat_table_links.png - Click Save .
Test the Links
In this section, you close and reopen the workbook to test the table links and data actions.
- Click Go back and click Save if prompted.
- On the Home page, hover over detailed_sales, click Actions , and then click Open.
- Click the Product Sales tab. In the Product Sales table, click Office Supplies in the Product Category column.

Description of the illustration prodcat_link.png - Close the pop up.
- Click Office Machines in the Product Sub Category column.

Description of the illustration prodsubcat_officemac_link.png
Learn More
Create Action Links in an Oracle Analytics Table
G26869-01
March 2025
Learn how to define data actions, create links in tables, and invoke analytics links that navigate to another canvas in the Oracle Analytics workbook.
This software and related documentation are provided under a license agreement containing restrictions on use and disclosure and are protected by intellectual property laws. Except as expressly permitted in your license agreement or allowed by law, you may not use, copy, reproduce, translate, broadcast, modify, license, transmit, distribute, exhibit, perform, publish, or display any part, in any form, or by any means. Reverse engineering, disassembly, or decompilation of this software, unless required by law for interoperability, is prohibited.
If this is software or related documentation that is delivered to the U.S. Government or anyone licensing it on behalf of the U.S. Government, then the following notice is applicable:
U.S. GOVERNMENT END USERS: Oracle programs (including any operating system, integrated software, any programs embedded, installed or activated on delivered hardware, and modifications of such programs) and Oracle computer documentation or other Oracle data delivered to or accessed by U.S. Government end users are "commercial computer software" or "commercial computer software documentation" pursuant to the applicable Federal Acquisition Regulation and agency-specific supplemental regulations. As such, the use, reproduction, duplication, release, display, disclosure, modification, preparation of derivative works, and/or adaptation of i) Oracle programs (including any operating system, integrated software, any programs embedded, installed or activated on delivered hardware, and modifications of such programs), ii) Oracle computer documentation and/or iii) other Oracle data, is subject to the rights and limitations specified in the license contained in the applicable contract. The terms governing the U.S. Government's use of Oracle cloud services are defined by the applicable contract for such services. No other rights are granted to the U.S. Government.
This software or hardware is developed for general use in a variety of information management applications. It is not developed or intended for use in any inherently dangerous applications, including applications that may create a risk of personal injury. If you use this software or hardware in dangerous applications, then you shall be responsible to take all appropriate fail-safe, backup, redundancy, and other measures to ensure its safe use. Oracle Corporation and its affiliates disclaim any liability for any damages caused by use of this software or hardware in dangerous applications.
Oracle and Java are registered trademarks of Oracle and/or its affiliates. Other names may be trademarks of their respective owners.
Intel and Intel Inside are trademarks or registered trademarks of Intel Corporation. All SPARC trademarks are used under license and are trademarks or registered trademarks of SPARC International, Inc. AMD, Epyc, and the AMD logo are trademarks or registered trademarks of Advanced Micro Devices. UNIX is a registered trademark of The Open Group.
This software or hardware and documentation may provide access to or information about content, products, and services from third parties. Oracle Corporation and its affiliates are not responsible for and expressly disclaim all warranties of any kind with respect to third-party content, products, and services unless otherwise set forth in an applicable agreement between you and Oracle. Oracle Corporation and its affiliates will not be responsible for any loss, costs, or damages incurred due to your access to or use of third-party content, products, or services, except as set forth in an applicable agreement between you and Oracle.