Before You Begin
Learn how to improve the looks of your workbooks on different screen sizes such as large desktop monitors, tablets, laptops, and mobile devices.
Background
In Oracle Analytics, you can design a workbook with multiple visualizations and multiple canvases. When you create a workbook the screen size defaults to the display size of your browser. Your user community might use a variety of devices to view Oracle Analytics workbooks. To ensure that your workbook provides the best experience for users no matter which device they're using, you can set screen breakpoints, rearrange the visualizations (canvas layout), or hide and remove visualizations for each device size.
Oracle Analytics provides three predefined screen sizes for laptops (1024 pixels), tablets (768 pixels), and mobile devices (450 pixels). You can specify custom screen sizes to fit the devices used by your user community.
What Do You Need?
- Access to Oracle Analytics
- Download the sample_worbook.dva to your computer.
Import the Sample Workbook
In this section, you import the sample_workbook.dva to use in this tutorial.
- Sign in to Oracle Analytics.
- On the Home page, click Page Menu
 and click Import Workbook/Flow.
 - In Import Workbook/Flow, click Select File, select sample_workbook.dva, and then click Import.
- A message could display indicating that the Oracle Analytics instance might have a dataset with the same name as the dataset used in the sample workbook. If so, click OK in the "Do you want to continue message?"
- In the Import successful message, click OK.
Review the Workbook
In this section, you open the workbook and begin designing the canvas layout for multiple devices. If you use a larger monitor, the images might not match this tutorial.
- On the Home page in sample_workbook, click Actions
 and then click Open.
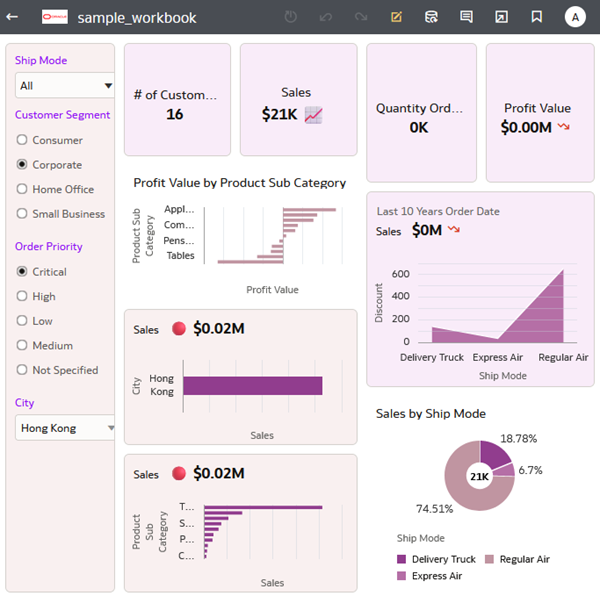
Description of the illustration sample_wbk.png - In the sample_workbook preview, click Edit
 .
. - Click Responsive Canvas Editor
 .
. - Click Open Responsive Layout Editor Menu
 , select Add Breakpoint at, and then select 768 - Tablet.
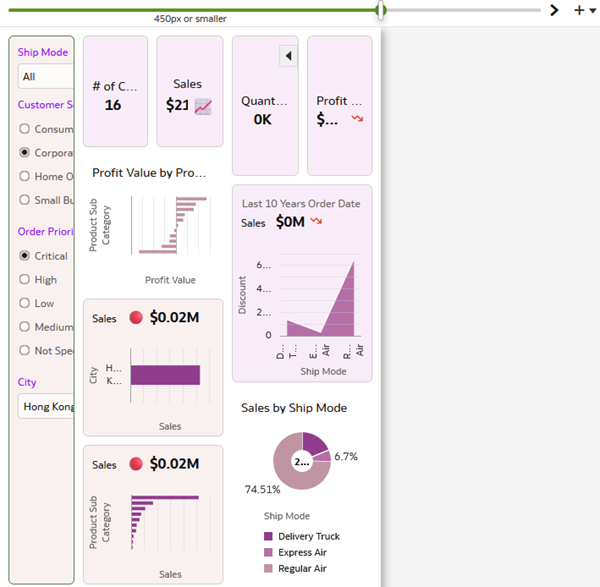
The workbook isn't significantly impacted when using the tablet breakpoint.

Description of the illustration tablet_screensize.png - Click Open Responsive Layout Editor Menu , select Add Breakpoint at, and then select 450 - Mobile.
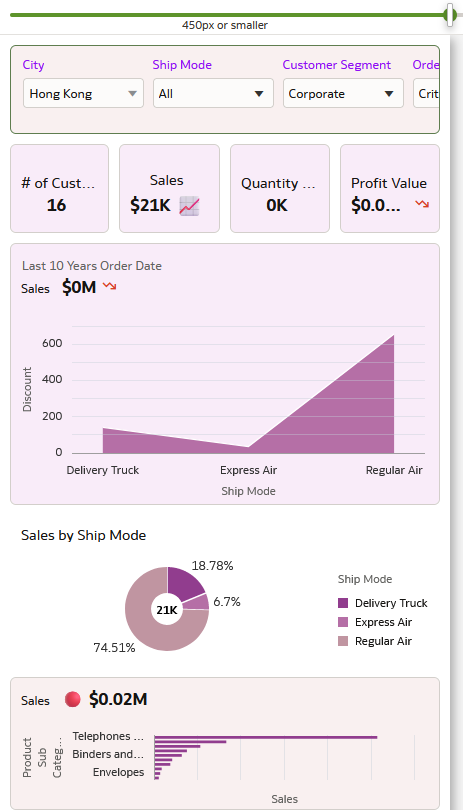
Changing the screen resolution to the 450 pixels for mobile devices makes the workbook's visualizations unusable.
Description of the illustration mobile_screensize.png
Design the Canvas Layout
In this section, you move the visualizations to improve the experience for mobile users.
- Hover the cursor over a visualization to move, use the handle
 to grab the visualization. A thick line shows where you can place the visualization.
The thick line and grab handle help you reposition the visualizations in the canvas.

Description of the illustration repositioning.png - Use the handle to move the dashboard filter control to the top of the canvas.
- Select the dashboard filter control. Click Properties
 . In Properties, click Filter Controls
  .
. - In Filter controls, expand Customer Segment, and Order Priority. In the Filter Type row of each data element type, click Inline List, and then click List Box.

Description of the illustration dashboard_control_layout.png - In the Sales by City horizontal bar visualization, click the Menu toggle
 , select Menu , and then select Hide Visualization.
 - In the Profit Value by Product Sub Category horizontal bar visualization, click the Menu toggle , select Menu , and then select Hide Visualization.
- Use the handle and move the large visualizations to arrange the visualizations into a single column.
- Select the dashboard filter control and click Grammar
 . In Filter Controls, select City and move it to the top of the list. Click Save
  .
.
Description of the illustration mobile_layout.png - Click Go back
 .
.
Review the Layout Changes
In this section, review the workbook and breakpoints.
- On the Home page in sample_workbook, click Actions and select Open.
The workbook opens in the preview and shows the workbook in your default screen size.
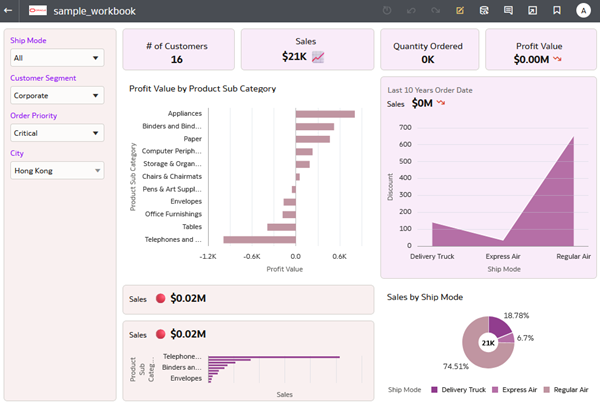
Description of the illustration wbk_after_breakpoints.png - Click Edit .
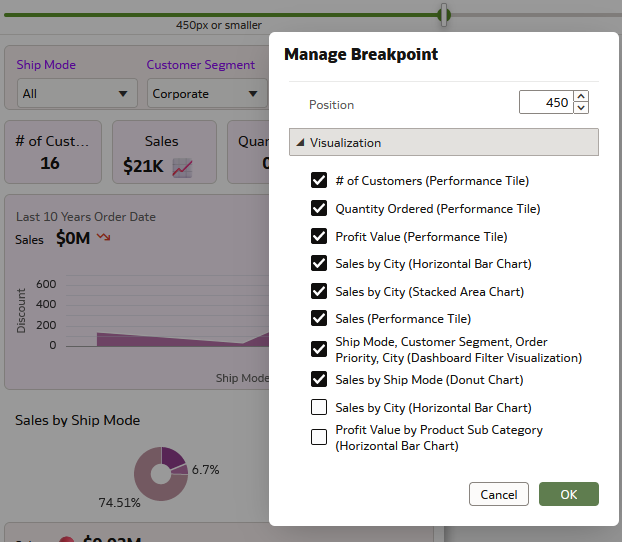
- Click Responsive Canvas Editor . Click Open Responsive Layout Editor Menu and select Manage Breakpoint.
Manage Breakpoint shows the visualizations on the current canvas in the workbook at the default screen size.

Description of the illustration manage_brkpnts.png - Click Cancel.
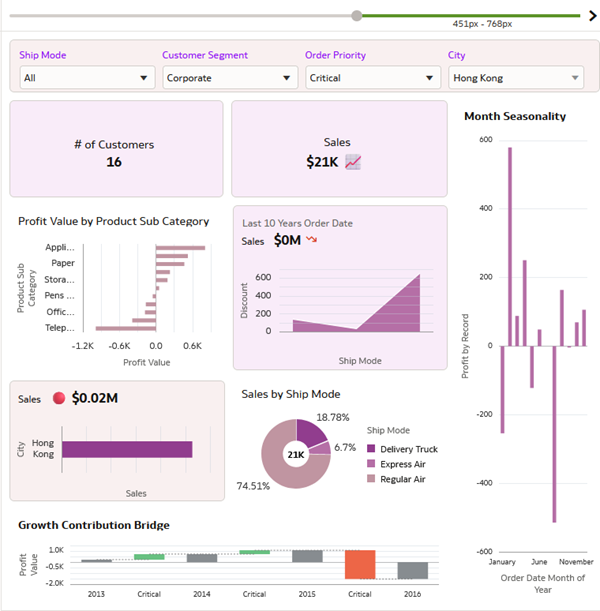
- Move the breakpoint ruler to the mobile breakpoint.
- Click Open Responsive Layout Editor Menu and select Manage Breakpoint.
Manage Breakpoint lists the visualizations shown in the mobile breakpoint. If you return the two visualizations you hide from the mobile layout, the usefulness of the workbook is decreased.
Description of the illustration breakpoint_loc_mobile.png
Modify the Workbook
In this section, you add visualizations to see the impact on the canvas layout at different breakpoints.
- Move the breakpoint ruler to the default full screen size.
- Click Auto Insights
 . Expand the Auto Insights panel, hover over Month Seasonality and click Add to Canvas...
  .
. - In the Auto Insights panel hover over Growth Contribution Bridge and click Add to Canvas... .

Description of the illustration auto_insights_vizs.png - Click Responsive Canvas Editor . Move the breakpoint ruler to the tablet size, 768 pixels marker.
- Click Open Responsive Layout Editor Menu and select Manage Breakpoint.
- In Manage Breakpoint, remove the check from Sales by City (Horizontal Bar), click Growth Contribution Bridge (Waterfall) and Month Seasonality (Stacked Bar Chart), and then click OK.
- Use the handle to move the dashboard filter control to the top of the canvas and arrange the remaining visualizations.
- Click the Menu toggle in the Quantity Ordered tile, select Menu , and then select Hide Visualization.
- Click the Menu toggle in the Profit Value tile, click Menu , and then select Hide Visualization. Click Save.
Description of the illustration tablet_layout.png - Move the breakpoint ruler to the right to see the full screen layout. Move the breakpoint ruler to the leftmost breakpoint to see the mobile layout.
Learn More
Design a Workbook for Multiple Devices in Oracle Analytics
F96387-01
May 2024
Learn how to set breakpoints to resize and rearrange canvas layouts in workbooks for monitors, laptops, tablets and mobile devices in Oracle Analytics.
This software and related documentation are provided under a license agreement containing restrictions on use and disclosure and are protected by intellectual property laws. Except as expressly permitted in your license agreement or allowed by law, you may not use, copy, reproduce, translate, broadcast, modify, license, transmit, distribute, exhibit, perform, publish, or display any part, in any form, or by any means. Reverse engineering, disassembly, or decompilation of this software, unless required by law for interoperability, is prohibited.
If this is software or related documentation that is delivered to the U.S. Government or anyone licensing it on behalf of the U.S. Government, then the following notice is applicable:
U.S. GOVERNMENT END USERS: Oracle programs (including any operating system, integrated software, any programs embedded, installed or activated on delivered hardware, and modifications of such programs) and Oracle computer documentation or other Oracle data delivered to or accessed by U.S. Government end users are "commercial computer software" or "commercial computer software documentation" pursuant to the applicable Federal Acquisition Regulation and agency-specific supplemental regulations. As such, the use, reproduction, duplication, release, display, disclosure, modification, preparation of derivative works, and/or adaptation of i) Oracle programs (including any operating system, integrated software, any programs embedded, installed or activated on delivered hardware, and modifications of such programs), ii) Oracle computer documentation and/or iii) other Oracle data, is subject to the rights and limitations specified in the license contained in the applicable contract. The terms governing the U.S. Government's use of Oracle cloud services are defined by the applicable contract for such services. No other rights are granted to the U.S. Government.
This software or hardware is developed for general use in a variety of information management applications. It is not developed or intended for use in any inherently dangerous applications, including applications that may create a risk of personal injury. If you use this software or hardware in dangerous applications, then you shall be responsible to take all appropriate fail-safe, backup, redundancy, and other measures to ensure its safe use. Oracle Corporation and its affiliates disclaim any liability for any damages caused by use of this software or hardware in dangerous applications.
Oracle and Java are registered trademarks of Oracle and/or its affiliates. Other names may be trademarks of their respective owners.
Intel and Intel Inside are trademarks or registered trademarks of Intel Corporation. All SPARC trademarks are used under license and are trademarks or registered trademarks of SPARC International, Inc. AMD, Epyc, and the AMD logo are trademarks or registered trademarks of Advanced Micro Devices. UNIX is a registered trademark of The Open Group.
This software or hardware and documentation may provide access to or information about content, products, and services from third parties. Oracle Corporation and its affiliates are not responsible for and expressly disclaim all warranties of any kind with respect to third-party content, products, and services unless otherwise set forth in an applicable agreement between you and Oracle. Oracle Corporation and its affiliates will not be responsible for any loss, costs, or damages incurred due to your access to or use of third-party content, products, or services, except as set forth in an applicable agreement between you and Oracle.