Before you Begin
This 10-minute tutorial shows you how to implement incremental processing in a data flow with a dataset created from a connection.
Background
You can use incremental processing in your data flow to add the latest data available from the connected data source to your dataset. When your data flow runs on a schedule, incremental processing enables updating the dataset between scheduled runs. In this tutorial, you learn how to specify a new data indicator column in the dataset to enable incremental processing and how to set parameters in the data flow to update the dataset.
Incremental processing is only available with datasets created from a connection.
What Do You Need?
- Access to Oracle Analytics
- Ability to connect a relational data source such as Oracle Autonomous Data Warehouse or Oracle Database
- Access to the Oracle sample SH schema to perform the steps in this tutorial, see Installing Sample Schemas
Create a Connection
This tutorial uses an Oracle Database connection to an instance with the SH schema. In this section, use these steps to create a connection to the data source.
This tutorial uses the Basic connection type for the non-clustered single node database. Use the Advanced connection type with multi-node database clusters that have multiple host names and ports.
If you already have a connection, you can skip to the next section.
- Sign in to Oracle Analytics.
- On the Home page, click Create, and then click Connection.
- In Create Connection - Select Connection Type, click your database connection type.
This example uses an Oracle Database connection type. Your connection variables depend on the selected database connection type.
- In Create Connection when using an Oracle Database, enter a Connection Name and select Basic as the connection type.
- Enter the values for these fields:
- Host
- Port
- Service Name
- User Name
- Password
- Click Save.
Create a Dataset
In this section, you create a dataset from the connection. In the next section, you use the dataset in a data flow.
- On the Home page, click Create, select Dataset, and then click the database connection containing the SH schema.
- In Connections
 , expand Schemas, expand the SH schema.
 - Hold down the Ctrl key and click the CUSTOMERS, PRODUCTS, SALES, and TIMES tables. Drag them to the Join Diagram.
Oracle Analytics automatically creates the joins using the relationships defined in the schema.
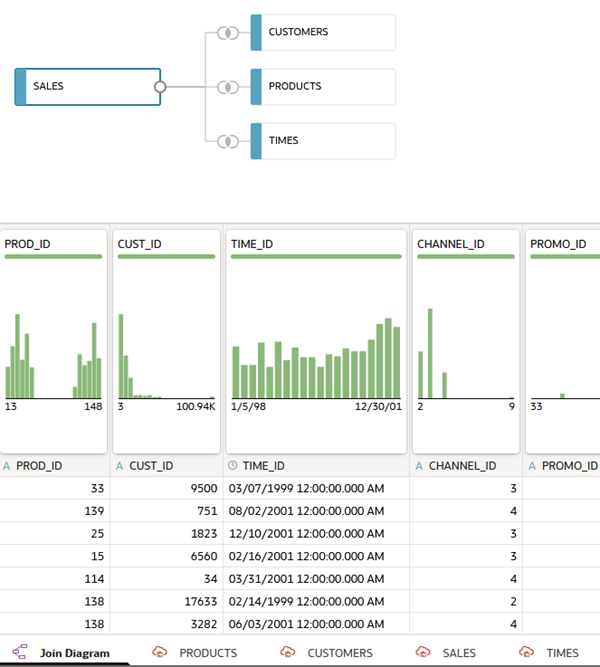
Description of the illustration data_set_tables.png - Click Save
 . In Save Dataset As, enter
 Customer Salesin Name, and then click OK.
Edit Table Definitions
In this section, you remove columns that aren't needed in the dataset. The CUSTOMERS table contains 23 data elements. The PRODUCTS table contains 22 data elements. You don't need all these columns in your dataset.
- Click the CUSTOMERS table tab. In the CUSTOMERS table use the horizontal scroll bar to view the columns.
- Click Edit Definition.
- In Edit Definition, click Remove All. Hold down the Ctrl key and select the following:
- CUST_ID
- CUST_CITY
- CUST_FIRST_NAME
- CUST_LAST_NAME
- CUST_GENDER
- CUST_POSTAL_CODE
- CUST_STATE_PROVINCE
- CUST_STREET_ADDRESS
- Click Add Selected, and then click OK.

Description of the illustration customers_edit_def.png - Click Save .
- Click the PRODUCTS table tab. Use the horizontal scroll bar to view the columns.
- Click Edit Definition.
- In Edit Definition, click Remove All. Hold down the Ctrl key and select the following:
- PROD_ID
- PROD_CATEGORY
- PROD_NAME
- PROD_SUBCATEGORY
- Click Add Selected, and then click OK.

Description of the illustration prod_edit_def.png - Click Save .
Specify New Data Indicator
In this section, you set the new data indicator property to update the dataset. In this example, when a sale occurs the transaction includes a time ID, making it a good new data indicator.
- Click the SALES table tab.
- In SALES table, click Edit Definition. Click Expand
 .
. - In Data Access, keep Live as the value.
- Expand Advanced. From Flow New Data Indicator
 , select TIME_ID, and then click OK.
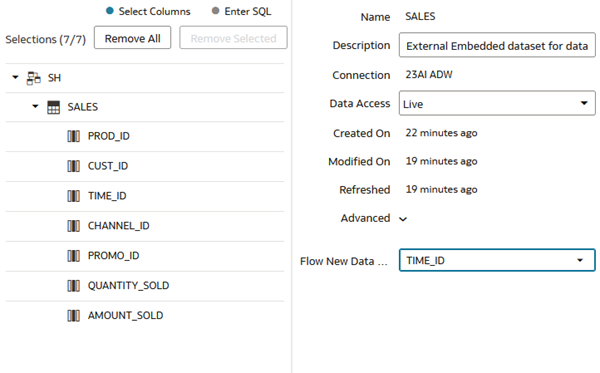
Description of the illustration new_data_indicator.png - Click Save . Click Go back
 .
.
Create a Data Flow
In this section, you create a data flow with the Customer Sales dataset.
- On the Home page, click Create, and then select Data Flow.
- In Add Dataset, click Customer Sales, and then click Add.
- In Add Data - Customer Sales, click Folder. In the Select All message, click Yes.
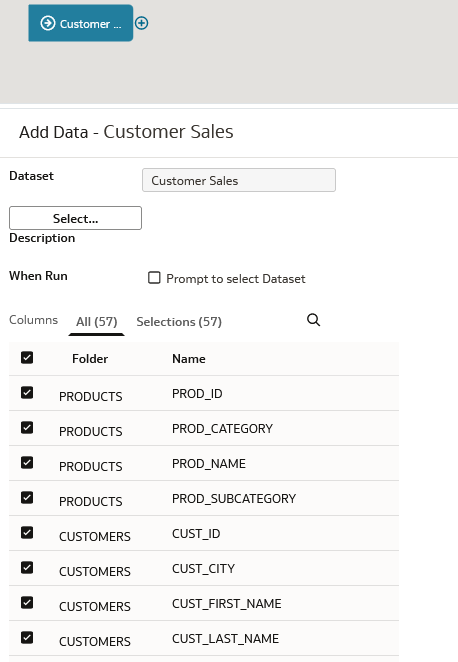
Description of the illustration cust_sales_node.png - On the Customer Sales node, click Add a step
 , and then click Filter.
 - In Filter, click Add Filter. From the Available data list, click PROD_CATEGORY. From the PROD_CATEGORY list, click Electronics.
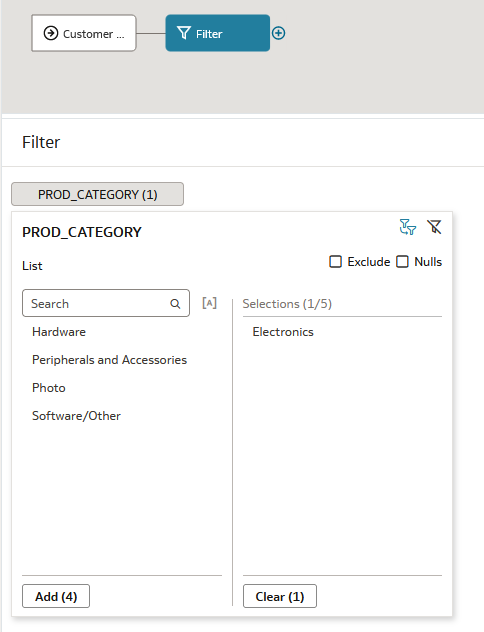
Description of the illustration filter_node.png - In the data flow, click Add a step on the Filter node. Select Save Data.
- In Save Dataset, enter
Electronics Sales. - From the Save data to list, select Database Connection. Click Database Connection. Next to Connection, click Select connection, and then choose the database with the table to update.
- In Table, enter
SALES. In the When run list, select Add new data to existing data.
Description of the illustration electronics_sales.png - Click Save. In Save Data Flow As, enter
Sales Revenues, and then click OK. - Click Run Data Flow
 .
.
Schedule the Data Flow
Incremental processing runs when changes occur in the data source between data flow runs. This section shows you how to schedule a data flow.
- On the Home page, click Data, enter
Sales Revenuesin the Search bar, and then press Enter. - Select your data flow, click Actions
 , and then select New Schedule.
 - In Sales Revenue, click New.
- In Schedule, enter a Name or keep the default name.
- Click the calendar in Start, and then select a start date. Click the calendar in End to specify an ending date or leave End empty.
- In Time, enter the hour and minutes of the start time. From the Repeat list, select a frequency for running the data flow, and then click OK.

Description of the illustration schedule_df.png
Learn More
Implement Incremental Processing in a Data Flow in Oracle Analytics
F14231-10
July 2025
Learn how to apply incremental processing in an Oracle Analytics data flow with a dataset created from a connection.
This software and related documentation are provided under a license agreement containing restrictions on use and disclosure and are protected by intellectual property laws. Except as expressly permitted in your license agreement or allowed by law, you may not use, copy, reproduce, translate, broadcast, modify, license, transmit, distribute, exhibit, perform, publish, or display any part, in any form, or by any means. Reverse engineering, disassembly, or decompilation of this software, unless required by law for interoperability, is prohibited.
If this is software or related documentation that is delivered to the U.S. Government or anyone licensing it on behalf of the U.S. Government, then the following notice is applicable:
U.S. GOVERNMENT END USERS: Oracle programs (including any operating system, integrated software, any programs embedded, installed or activated on delivered hardware, and modifications of such programs) and Oracle computer documentation or other Oracle data delivered to or accessed by U.S. Government end users are "commercial computer software" or "commercial computer software documentation" pursuant to the applicable Federal Acquisition Regulation and agency-specific supplemental regulations. As such, the use, reproduction, duplication, release, display, disclosure, modification, preparation of derivative works, and/or adaptation of i) Oracle programs (including any operating system, integrated software, any programs embedded, installed or activated on delivered hardware, and modifications of such programs), ii) Oracle computer documentation and/or iii) other Oracle data, is subject to the rights and limitations specified in the license contained in the applicable contract. The terms governing the U.S. Government's use of Oracle cloud services are defined by the applicable contract for such services. No other rights are granted to the U.S. Government.
This software or hardware is developed for general use in a variety of information management applications. It is not developed or intended for use in any inherently dangerous applications, including applications that may create a risk of personal injury. If you use this software or hardware in dangerous applications, then you shall be responsible to take all appropriate fail-safe, backup, redundancy, and other measures to ensure its safe use. Oracle Corporation and its affiliates disclaim any liability for any damages caused by use of this software or hardware in dangerous applications.
Oracle and Java are registered trademarks of Oracle and/or its affiliates. Other names may be trademarks of their respective owners.
Intel and Intel Inside are trademarks or registered trademarks of Intel Corporation. All SPARC trademarks are used under license and are trademarks or registered trademarks of SPARC International, Inc. AMD, Epyc, and the AMD logo are trademarks or registered trademarks of Advanced Micro Devices. UNIX is a registered trademark of The Open Group.
This software or hardware and documentation may provide access to or information about content, products, and services from third parties. Oracle Corporation and its affiliates are not responsible for and expressly disclaim all warranties of any kind with respect to third-party content, products, and services unless otherwise set forth in an applicable agreement between you and Oracle. Oracle Corporation and its affiliates will not be responsible for any loss, costs, or damages incurred due to your access to or use of third-party content, products, or services, except as set forth in an applicable agreement between you and Oracle.