Before You Begin
This tutorial shows you how to apply a visibility parameter to a visualization that shows or hides the visualization based on meeting the visibility condition in Oracle Analytics.
Background
You use the show_hide_exact.dva workbook file to learn how to set the visibility parameter. You also use two different measures in a dashboard filter control to enable selecting a single measure and showing the related visualizations. You must set the visibility parameter's condition in each visualization to control whether the visualization is shown or hidden.
What Do You Need?
- Access to Oracle Analytics
- Download show_hide_exact_wbk.dva to your computer
Import a Workbook
In this section, you import a workbook with sales and profit visualizations.
- Sign in to Oracle Analytics.
- On the Home page, click Page Menu
 , select Import Workbook/Flow.
 - In Import Workbook/Flow, click Select File. In File Upload, select show_hide_exact_wbk.dva and click Open.
- In Import Workbook/Flow, click Import. When the message, Import successful displays, click OK.
- Hover over show_hide_exact_wbk, click Actions
 , and then select Open.
 - Click Edit
 .
.
Description of the illustration show_hide_exact_wbk.png
Create a Parameter
In this section, you a create parameter and a dashboard filter control so users can select a measure.
- Click Parameters
 .
. - In Parameters, click Menu
 and select Add Parameter.
 - In Create Parameter, enter
Measuresin Name. - Select Value from the Available Values list. Enter
Salesin the Value field. - Click Add
 , enter
 Profitin the Value field, and then click OK.
Description of the illustration measures_param.png - Click Visualizations
 . Under Dashboard Controls, select Dashboard Filters
  , drag it to the canvas, and then release it above the profit visualizations.
 - Click Parameters . Select and drag the Measures parameter to the dashboard filter control.
- Click Properties
 . In the Label Font row, click Auto. Use the font size list to select 18 and click Bold.
 - In Properties, click Filter Controls
 . In the Label row, click Auto and select Custom. In the Label field, enter
 Select a Measure.
Description of the illustration meas_param_in_dshbd.png
Specify the Visibility for the Profit Visualizations
In this section, you set the visibility of each visualization using the visibility parameter.
- Select the Profit by Product Sub Category visualization and click Properties .
- In the Visibility row, click None and select Measures.
- Click Visibility Settings
 . In Measures, click the Condition list and select Exact Match. Click Profit and click outside of the dialog.
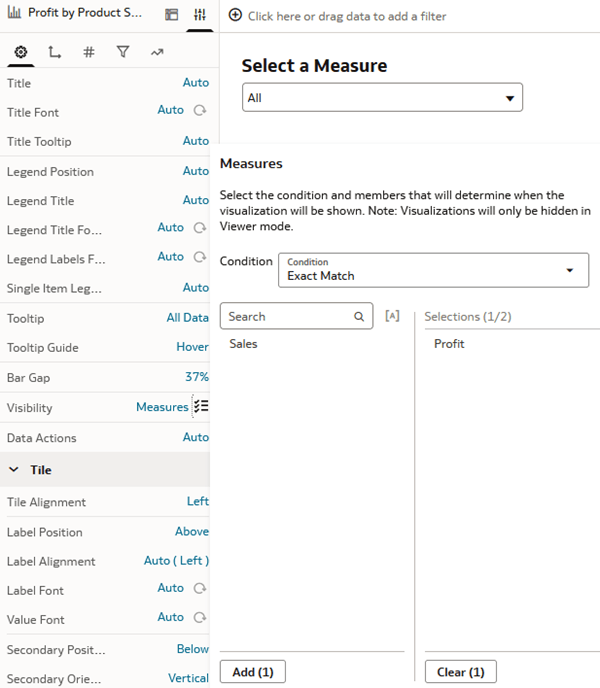
Description of the illustration set_measure_condition.png - Select the Profit by Ship Date (Year) visualization, click Change Visualization Type
 and select Horizontal Bar
  .
. - In Properties, click None in the Visibility row and select Measures. Click Visibility Settings . In Measures, click the Condition list and select Exact Match. Click Profit and click outside of the dialog.
- Select the Profit by Customer Segment visualization. In Properties, click None in the Visibility row and select Measures.
- Click Visibility Settings . In Measures, click the Condition list and select Exact Match. Click Profit and click outside of the dialog.
Specify the Visibility for the Sales Visualizations
In this section, you set the visibility parameter for each of the sales visualizations.
- Select the Sales by Product Sub Category visualization. In Properties, click None in the Visibility row and select Measures.
- Click Visibility Settings . In Measures, click the Condition list and select Exact Match. Click Sales and click outside of the dialog.
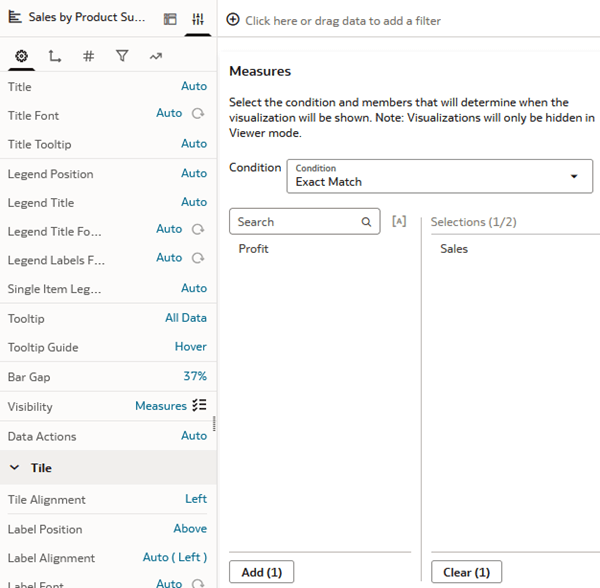
Description of the illustration set_meas_sales.png - Select the Sales by Ship Date (Year) visualization. In Properties, click None in the Visibility row and select Measures.
- Click Visibility Settings . In Measures, click the Condition list and select Exact Match. Click Sales and click outside of the dialog.
- Select the Sales by Customer Segment visualization. In Properties, click None in the Visibility row and select Measures.
- Click Visibility Settings . In Measures, click the Condition list and select Exact Match. Click Sales and click outside of the dialog.
- Click Save
 .
.
Preview the Workbook
In this section, you review the visibility parameter's impact on the visualizations.
- Click Preview
 .
.
When the Measures parameter is set to All, the sales and profit visualizations aren't visible.

Description of the illustration no_measure_selected.png - In the Preview, click All under Select a Measure and select Profit.
Oracle Analytics displays the profit visualizations.

Description of the illustration preview_profit_vizs.png - In the Preview, click Profit under Select a Measure and select Sales.
Oracle Analytics hides the profit visualizations and displays the sales visualization. The canvas shows an empty area where the profit visualizations remain hidden on the canvas.

Description of the illustration preview_sales_vizs.png
Eliminate the Empty Space
In this section, you duplicate the canvas to demonstrate how you can eliminate the empty space left by the hidden visualizations.
- Click Edit . Click Save .
- Click Canvas 1 menu
 and select Duplicate Canvas.
 - Click Canvas 1 Copy menu and select Rename. Enter
Canvas 2as the new name and click the check .
. - Click Canvas 2 menu and select Canvas Properties. In the Layout row, click Auto Fit , select Freeform, and then click OK.
- Use the handle
 to move the Sales visualizations on top of the profit visualizations.
Description of the illustration sales_on_profit_vizs.png - Click Preview . In Select a Measure, choose Sales.

Description of the illustration sales_no_empty_canvas.png
Learn More
Control Visualization Visibility in Oracle Analytics
G18930-02
March 2026
Learn how to show or hide visualizations using a visibility parameter in Oracle Analytics.
This software and related documentation are provided under a license agreement containing restrictions on use and disclosure and are protected by intellectual property laws. Except as expressly permitted in your license agreement or allowed by law, you may not use, copy, reproduce, translate, broadcast, modify, license, transmit, distribute, exhibit, perform, publish, or display any part, in any form, or by any means. Reverse engineering, disassembly, or decompilation of this software, unless required by law for interoperability, is prohibited.
If this is software or related documentation that is delivered to the U.S. Government or anyone licensing it on behalf of the U.S. Government, then the following notice is applicable:
U.S. GOVERNMENT END USERS: Oracle programs (including any operating system, integrated software, any programs embedded, installed or activated on delivered hardware, and modifications of such programs) and Oracle computer documentation or other Oracle data delivered to or accessed by U.S. Government end users are "commercial computer software" or "commercial computer software documentation" pursuant to the applicable Federal Acquisition Regulation and agency-specific supplemental regulations. As such, the use, reproduction, duplication, release, display, disclosure, modification, preparation of derivative works, and/or adaptation of i) Oracle programs (including any operating system, integrated software, any programs embedded, installed or activated on delivered hardware, and modifications of such programs), ii) Oracle computer documentation and/or iii) other Oracle data, is subject to the rights and limitations specified in the license contained in the applicable contract. The terms governing the U.S. Government's use of Oracle cloud services are defined by the applicable contract for such services. No other rights are granted to the U.S. Government.
This software or hardware is developed for general use in a variety of information management applications. It is not developed or intended for use in any inherently dangerous applications, including applications that may create a risk of personal injury. If you use this software or hardware in dangerous applications, then you shall be responsible to take all appropriate fail-safe, backup, redundancy, and other measures to ensure its safe use. Oracle Corporation and its affiliates disclaim any liability for any damages caused by use of this software or hardware in dangerous applications.
Oracle and Java are registered trademarks of Oracle and/or its affiliates. Other names may be trademarks of their respective owners.
Intel and Intel Inside are trademarks or registered trademarks of Intel Corporation. All SPARC trademarks are used under license and are trademarks or registered trademarks of SPARC International, Inc. AMD, Epyc, and the AMD logo are trademarks or registered trademarks of Advanced Micro Devices. UNIX is a registered trademark of The Open Group.
This software or hardware and documentation may provide access to or information about content, products, and services from third parties. Oracle Corporation and its affiliates are not responsible for and expressly disclaim all warranties of any kind with respect to third-party content, products, and services unless otherwise set forth in an applicable agreement between you and Oracle. Oracle Corporation and its affiliates will not be responsible for any loss, costs, or damages incurred due to your access to or use of third-party content, products, or services, except as set forth in an applicable agreement between you and Oracle.