Viewing Gateway Analytics
You can use analytics to determine how, when, and why requests are sent to your gateways, review how often and why requests are rejected, and monitor data trends.
Gateway Managers must be issued the Manage Gateway or View All Details gateway grant to view analytics for that gateway.
Gateway Analytics Charts Available on the General Page
View the request volume, response time, and other metrics about requests sent to your gateways on the General page.
Request Volume Chart
Use the Request Volume chart to view request traffic volume, request trends, and request success or failure rates. The Request Volume chart displays the number of requests sent to an all APIs deployed to a gateway.
To view Request Volume chart data:
-
Select All to display all requests.
-
Select Successful to display successful requests.
-
Select Rejected to display rejected requests.
-
Select Failed to display requests that failed.
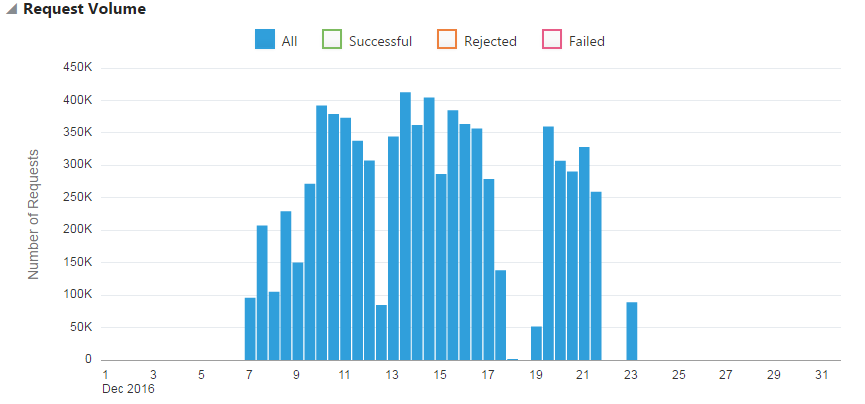
Description of the illustration request-volume-chart-mp.png
To view summary information for a specific period, hover your mouse over a vertical bar in the Request Volume chart.
By default, data for the current day is displayed. To display data for a different period, see Working with Analytics Time Controls.
Response Time Chart
Use the Response Time chart to view the median response times for requests, response time trends, and the time requests spend in the API and service layers. The Response Time chart displays round-trip request and response times (in milliseconds) for the selected gateway. The shortest and longest response times for the period are represented by vertical bars. A horizontal bar indicates the median round-trip time for the period.
To view Response Time chart data:-
Select Round Trip to display the median, the shortest, and the longest round-trip request and response times for the period.
-
Select API Layer to display the median, the shortest, and the longest time that requests and responses were active in the API layer for the period.
-
Select Service Layer to display the median, the shortest, and the longest time that requests and responses were active in the service layer for the period.
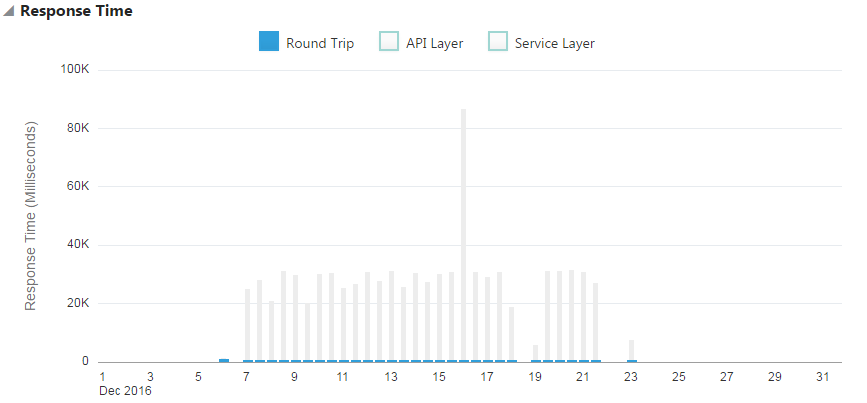
Description of the illustration response-time-chart-mp.png
To view summary information for a specific period, hover your mouse over a vertical or horizontal bars in the Response Time chart.
By default, data for the current day is displayed. To display data for a different period, see Working with Analytics Time Controls.
Payload Size Chart
The Payload Size chart displays the size of the payload sent with each request. The largest and smallest payload sizes for the period are represented by vertical bars. A horizontal bar indicates the median payload size during the period.
To view Payload Size chart data:
-
Select Request to view request payload sizes for the period.
-
Select Response to view response payload sizes for the period.

Description of the illustration payload-size-chart.png
To view summary information for a specific period, hover your mouse over a vertical bar in the Payload Size chart.
By default, data for the current day is displayed. To display data for a different period, see Working with Analytics Time Controls.
Requests by API Chart
The Requests by API chart displays requests, rejections, and errors for each API deployed to the gateway.
The Requests by API chart displays this data:
-
The volume of requests sent to each API.
-
The percentage of requests sent to each API.
-
The volume of rejected requests for each API.
-
The percentage of rejected requests for each API.
-
The error volume for each API.
-
The error percentage for each API.

Description of the illustration requests-api.png
Requests by Resource Chart
The Requests by Resource chart displays the volume and distribution of requests (as a percentage) to resources for APIs deployed to your gateway.
The Requests by Resource chart displays this data:
-
The volume of requests sent to each resource.
-
The percentage of requests sent to each resource.
-
The volume of rejected requests for each resource.
-
The percentage of rejected requests for each resource.
-
The volume of errors processed by each resource.
-
The percentage of errors processed by each resource.

Description of the illustration requests-resource.png
Gateway Analytics Charts Available on the Applications Page
You can see how many requests, per application, have been sent to your gateways on the Applications page of the Analytics tab.
Active Applications Chart
The Active Applications chart displays the requests, rejections, and errors resulting from requests to all APIs deployed to a gateway. Applications are identified by application keys passed with each request. Requests passed without application keys are collected in an Unknown Applications entry in the chart. If the API is not secured by a key validation policy, all requests, regardless of whether application keys are passed, are collected in the Unknown Applications entry.
The Active Applications chart displays this data:
-
The volume of requests sent from each application.
-
The percentage of requests sent from each application.
-
The volume of rejected requests sent from each application.
-
The percentage of rejected requests sent from each application.
-
The error volume for requests sent from each application.
-
The error percentage for requests sent from each application.

Description of the illustration active-applications.png
Gateway Analytics Charts Available on the Errors and Rejections Page
View rejection and error metrics about requests sent to your gateways on the Errors and Rejections page.
Rejection Rate Chart
The Rejection Rate chart displays the number of rejected requests sent to all APIs deployed to a gateway.
To view Rejection Rate chart data:
-
Select All to view all rejections for the period.
-
Select Request Policies to view requests that were rejected by request policies for the period.
-
Select Response Policies to view responses that were rejected by response policies for the period.
-
Select Service to view requests that were rejected by the backend service.
-
Select an option in the no policy filter list: select a policy type (like Header Validation) to view data for all policies of that type, or select the name of a specific policy instance (like tenant-id validation, when that is the name of a specific header validation policy) to view data for that specific policy instance.
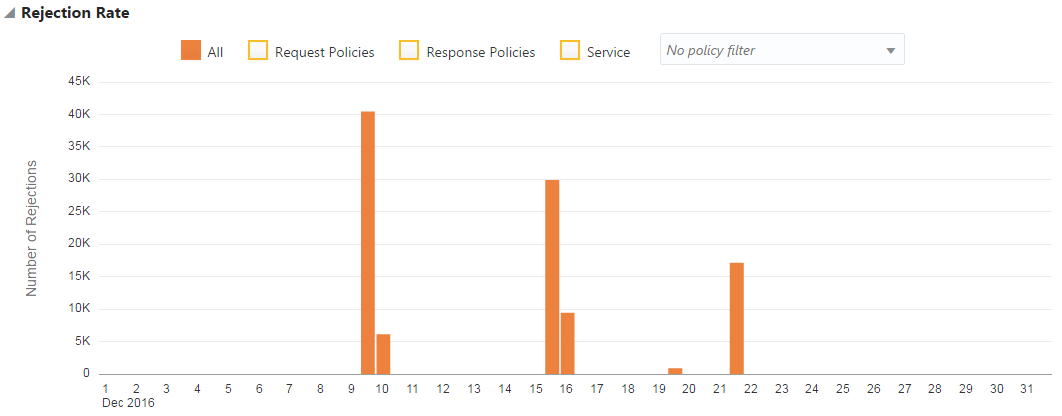
Description of the illustration rejection-rate.png
To view summary information for a specific period, hover your mouse over a vertical bar in the Rejection Rate chart.
By default, data for the current day is displayed. To display data for a different period, see Working with Analytics Time Controls.
Rejection Distribution Chart
The Rejection Distribution chart displays the number of rejections by specific policies or services.
To view Rejection Distribution chart data:
-
Select All to view all rejections per policy or service.
-
Select Request Policies to view the number of rejections per request policy.
-
Select Response Policies to view the number of rejections per response policy.
-
Select Service to view the number of rejections per service.
-
Select Show Policy Types to view rejections for each policy type. For example, if you have multiple header validation policies, selecting Show Policy Types displays all header validation policy rejections as a single data point.
-
Select Show Policy Instances to view rejections for each instance of a policy. For example, if you have multiple header validation policies, selecting Show Policy Instances displays rejections from each of the header validation policies as separate data points.
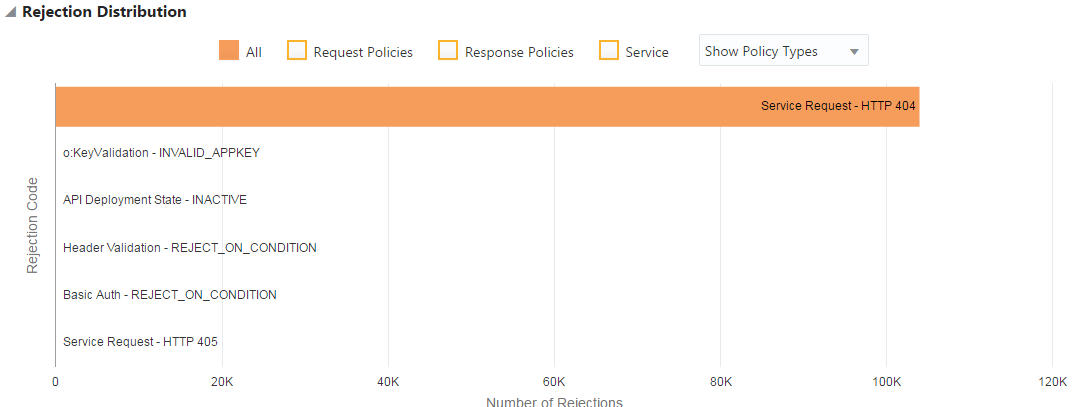
Description of the illustration rejection-distribution.png
To view summary information for a specific policy, hover your mouse over a horizontal bar in the Rejection Distribution chart.
By default, data for the current day is displayed. To display data for a different period, see Working with Analytics Time Controls.
Error Rate Chart
The Error Rate chart displays the number of errors for the defined period.
To view Error Rate chart data:
-
Select All to view all errors for the period.
-
Select Request Policies to view errors caused by request policies for the period.
-
Select Response Policies to view errors caused by response policies for the period.
-
Select Service to view errors caused by backend service.
-
Select an option in the no policy filter list: select a policy type to view data for all policies of that type, or select the name of a specific policy instance to view data for that specific policy instance.
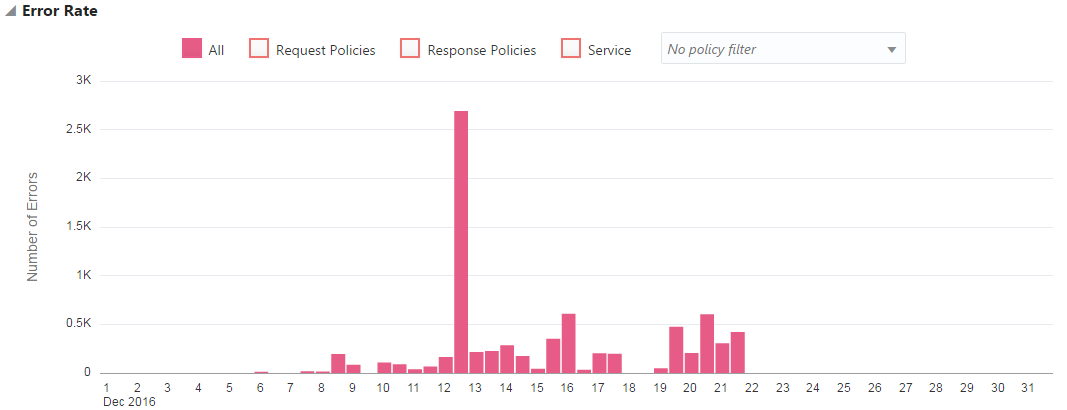
Description of the illustration error-rate.png
To view summary information for a specific period, hover your mouse over a vertical bar in the Error Rate chart.
By default, data for the current day is displayed. To display data for a different period, see Working with Analytics Time Controls.
Error Distribution Chart
The Error Distribution chart displays the number of API request errors for specific policies.
To view Error Distribution chart data:
-
Select All to view all errors.
-
Select Request Policies to view errors caused by request policies.
-
Select Response Policies to view errors caused by response policies.
-
Select Service to view errors caused by the backend service.
-
Select Show Policy Types to view errors for each policy type. For example, if you have multiple header validation policies, selecting Show Policy Types displays all header validation policy rejections as a single data point.
-
Select Show Policy Instances to view errors for each instance of a policy. For example, if you have multiple header validation policies, selecting Show Policy Instances displays rejections from each of the header validation policies as separate data points.
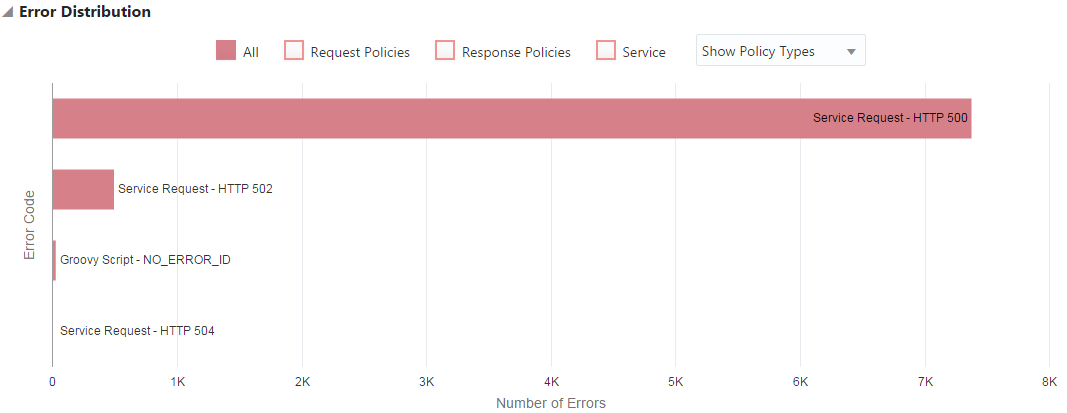
Description of the illustration error-distribution.png
To view summary information for a specific policy, hover your mouse over an entry in the Error Distribution chart.
 (Analytics) tab.