 Create
a Simple Web Application for Charts in Oracle Visual Builder
Create
a Simple Web Application for Charts in Oracle Visual Builder Before You Begin
This 10-minute tutorial shows you how to create a simple visual application and import business objects for the purpose of creating charts.
Background
Charts enable you to display your data visually, as an alternative to tables.
In this tutorial, you create a simple application and import data from a zip file. You'll use this application as the basis for learning about charts.
What Do You Need?
- Access to Oracle Visual Builder
- A supported browser
 Create
a Web Application
Create
a Web Application
- In the web browser, log in to Oracle Visual Builder if necessary.
- On the Visual Applications page, click New.

Description of the illustration vbcsch1_cra_s2.png - In the Create Application dialog box, enter the following.
- Application Name:
Charts Application - Description:
Charts tutorial
                        application
The Application ID text field is automatically populated as you type based on the Application Name. The Application template field is set to Empty Application.
- Application Name:
- Click Finish.
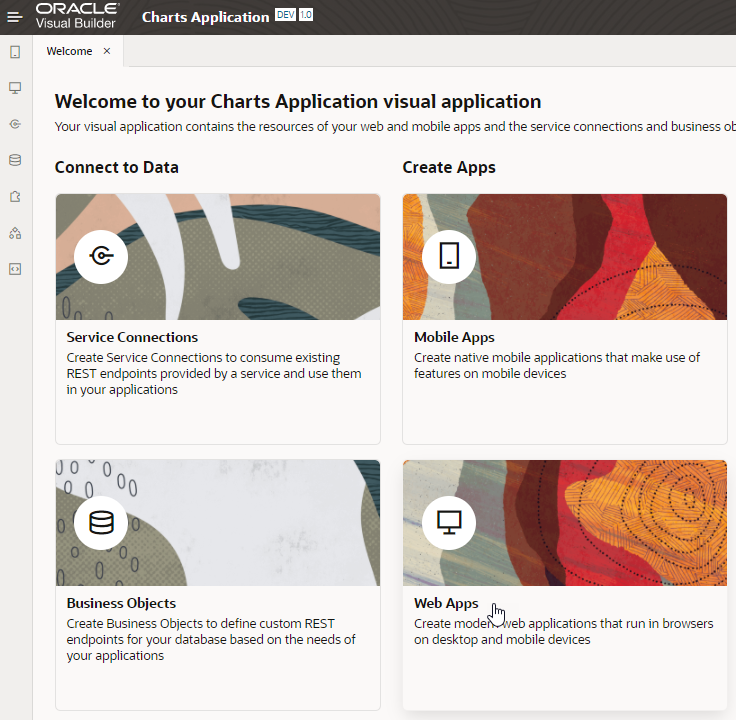
The application is created and opens on the Welcome page.
- Click the Web Apps tile, then click + Web Application (or click the + sign at the top of the pane).
- In the Create Web Application dialog box, enter
chartwebappin the Id field. Leave the Navigation Style set to the default, None, and then click Create.The application opens on the main-start page.
 Import
Data for Three Business Objects
Import
Data for Three Business Objects
In this step, you'll import data from a zip file to create three business objects for the application. Instead of creating the business objects and fields one by one and then importing data for them, you'll import the business objects and data all at once.
- Click this link
and download the
chart_application.zipfile. The zip file contains CSV files for the business objects of the Charts Application. Feel free to review the contents of the zip file. - Click the Business Objects
 tab.
tab. - Click the Business Objects Menu
 and select Data
Manager.
and select Data
Manager.

Description of the illustration vbcsch1_imp_s3.png - Click Import Business Objects.
- On the Upload File page of the wizard,
click the box and select the
chart_application.zipfile. - When the upload succeeds, click Next.

Description of the illustration vbcsch1_imp_s6.png - On the Business Objects page, you'll find that three business objects were created: Region, Sales, and Summary. Click Next.
- On the Fields page, you'll need to make some changes. The Region business object is correct as is. Click Sales to display the fields for that object.
- In the first row (Region), click Number
 in
the Type column and change
the setting as follows:
in
the Type column and change
the setting as follows:
- Type: Reference

- Referenced Business Object: Region
- Display Field: Name (automatically selected)
Click OK
 .
.
Description of the illustration vbcsch1_imp_s9.png - Type: Reference
- In the third row (Year), click Number
in
the Type column. Change
the Type from Number to String
 and click OK .
 - Click Summary and change the Region
field to type Reference, as you did for
Sales.
Here, the Year field is already set to String because some data values are not numeric.
- Click Finish.
- In the Applying Changes dialog box, click Close after the data import finishes successfully.
- Click the Region business object in the Navigator, then click the Data tab to view the imported data. Do the same for the Sales and Summary business objects. Sales and Summary have the same fields but different data.
- In the Business Objects pane, click +, then select Business Object Diagram.
- In the Create Business Object Diagram dialog box, enter
ChartDiagramin the Diagram name field and click Create. - In the Properties pane, click Select All
to see the three business objects you created and their
relationships.

Description of the illustration vbcsch1_imp_s17.png You have now imported data to the application, and can create charts to display that data.