Get Familiar with the Home Page
When you sign in to Oracle Integration, the Home page opens. From here, you can navigate to the product features you want, view a mini dashboard of relevant metrics and status, and link directly to your current tasks, applications, and work in progress.

Take a moment to get familiar with all you can do on the Home page.
| Home Page Element | Description |
|---|---|
|
Click to show or hide the navigation pane and menu. The Home page gives you quick access to what you do in
Oracle Integration. However, it's not your only option. At any
time, you can click Show/Hide navigation menu
|
|
| Instance_name (Shape) |
Displays the name and shape of your instance.
Note: You can't change the shape after you create the instance. However, you can move data to another instance using the export and import features. |
|
|
Click to display links that show the status of connectivity agents, active integrations, and certificate expiration dates. See View Notification Alert Announcements. |
|
|
Click to display the current progress of some asynchronous, design-time operations. This view eliminates the need to constantly refresh the page to check progress concerning this Oracle Integration instance. See View the Progress of Asynchronous, Design-Time Operations. |
|
Alerts icon |
Click to display alerts. For example, an alert is visible if you have activated more than 90% of the allowed limit of 700 integrations. The alert provides a link to the Integration dashboards page for details. |
|
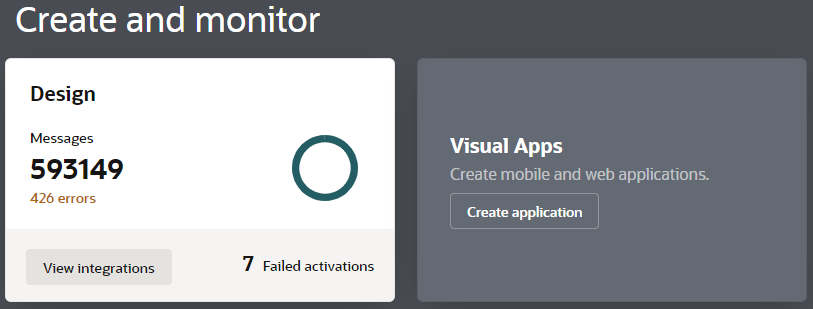
Create and monitor |
Gives you a snapshot of key metrics for your integrations and visual applications. For a break down of the total numbers, hover over a color on the circle graphic. For quick access to more details, click an individual card. |
|
Create integration |
Click to select either Application
or Schedule to open the Create
integration pane for creating a new application or
schedule integration.
If you want to create the new integration in a project, select the project name from the Project drop-down list, or type a new project name to create a new project that includes your new integration. If you do not want to create the integration in a project, see Create an Integration in Using Integrations in Oracle Integration 3. |
|
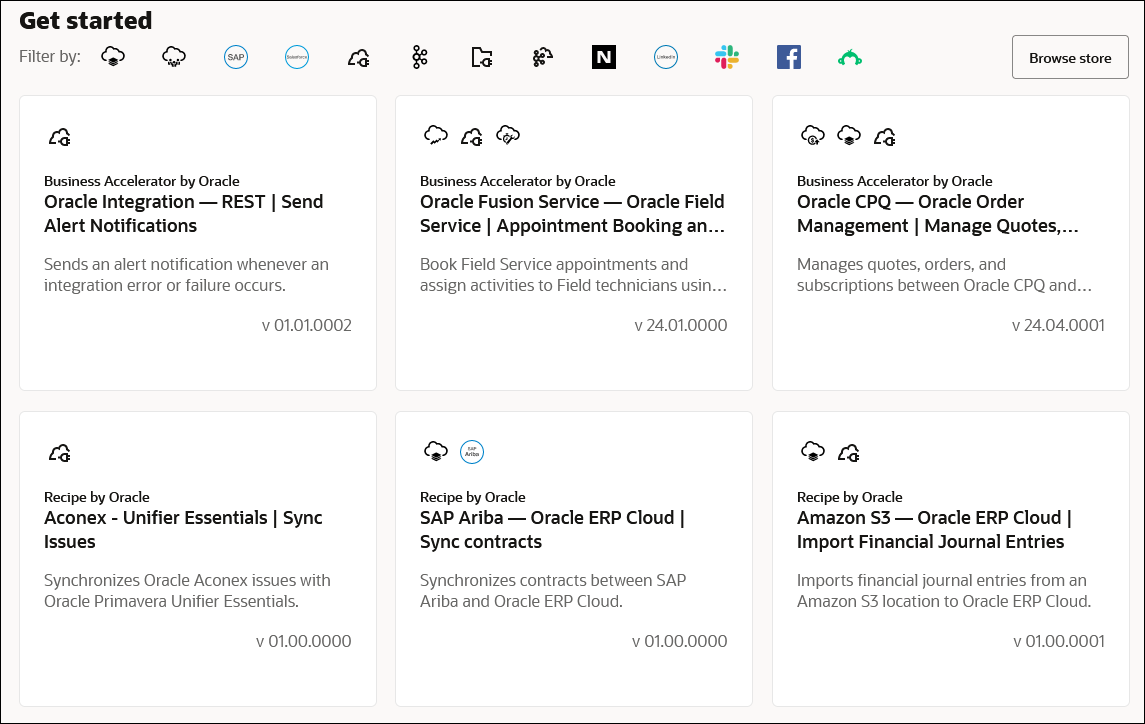
Get started |
Lists the recipes and accelerators available in Oracle Integration, which you can use to jump-start your integration development. Filter the list by clicking the Filter by product icons. To browse the entire collection, click Browse store. |
|
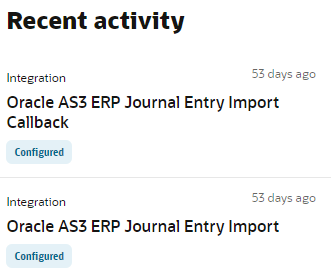
Recent activity |
Provides direct access to the integrations most recently updated. This provides a quick and easy way to return to your work. |
Get Stats at a Glance
The Create and monitor section on the Home page gives you a snapshot of key metrics for your integrations and visual applications.
For a breakdown of the total numbers, hover over a color on the circle graphic. For quick access to more details, click an individual card.

| Summary Item | Description | Action |
|---|---|---|
|
Design |
Shows the total number of messages, errors, and failed activations. |
Click View integrations to open the Integrations page listing all integrations, where you can search and filter for integrations of interest. To see more, click errors below the message count or hover over and click areas on the circle graphic to open the Dashboards page and get a comprehensive view of how your integrations are performing. See View the Dashboard in Using Integrations in Oracle Integration 3. |
|
Process Apps |
Shows the total number of process applications that have been activated over a specified time. Use the drop-down menu to select a period of the last 24 hours, 48 hours, or 7 days. To see the number of completed processes, position the cursor over the green area. To see the number of processes that are in progress, position the cursor over the blue area |
Click to launch Oracle Cloud Infrastructure Process Automation to rapidly design, automate, and manage business processes that can be used in integrations. See Overview of Oracle Cloud Infrastructure Process Automation. |
| Visual Apps |
Shows the total number of visual applications. Hover over each pie section to see the number of applications in that category. |
Opens the Visual Builder page, which provides access to all visual applications. On this page, you can create new applications and work with existing ones. See Get Started with Visual Builder in Developing Applications with Oracle Visual Builder in Oracle Integration 3. |
Explore Recipes and Accelerators
Oracle Integration offers a rich set of prebuilt, sample use cases called recipes, and also run-ready business and technical integrations called accelerators. Recipes and accelerators give you a head start in creating your integrations and provide end-to-end connections for critical business problems.
The Get started section on the Home page displays some of the available recipes and accelerators.

To browse the entire collection, click Browse store, and then search, filter, and sort the list to find the accelerator or recipe you want to use.
You can install a recipe or accelerator, configure its connections, and activate its integrations. See Install a Recipe or Accelerator in Using Recipes and Accelerators in Oracle Integration 3.
Open Recently Worked On Items
The Recent activity section on the Home page lists the items that you worked on recently.
No need to navigate the menus and search for where you left off. Instead, click the card in the Recent activity section to return to your work. It's fast, direct, and personalized for you.

Questions? Ask Oracle Assistant
Oracle Assistant is a digital assistant that can answer common questions about Oracle Integration. If you have questions about Oracle Integration, ask Oracle Assistant.
Oracle Assistant joined Oracle Integration in August 2021 and was developed using Oracle Digital Assistant. You can ask questions in full sentences and Oracle Assistant will try getting the best answer for you, even searching the product documentation. You can ask general questions about Oracle Integration or specific questions about its capabilities.
When you ask questions, try to be as specific as you can in what you're looking for. For example, if you're looking for information on three-legged Oauth configuration, tell the assistant "Oauth three-legged configuration", instead of "Oauth integration". You'll get better answers that way.
Oracle Assistant is constantly improving, so the assistant does get better with time. The more you use the assistant, the more the assistant improves.
- "Find" with a keyword to immediately search the product documentation for information.
- "Not helpful", to make a note so that the team can improve Oracle Assistant.