Determine the Source of an Integration's Error
Find the source of an error by checking the activity stream. You can also see the location of the error within an integration flow on the integration canvas.
- In the navigation pane, click Observability, then Integrations.
- Click Filter
 , and update the filtering requirements for the page.
 - In the Errored column, look for any non-zero values.
- For an integration with one or more errors, determine the location of the
error(s).
- Click the number value in the Errored column for
the integration.The Errors page appears and shows only the integration instances that experienced errors.
- For an error, review the value in the Fault
location column.The fault location indicates where the error occurred. For example, if errors occurred for an invoke that multiple integration instances use, the application that the invoke connection is connecting to might be unavailable.
- Click the number value in the Errored column for
the integration.
- Locate the source of the issue by reviewing the activity stream.
- Hover over an errored integration instance, and select View
details
 .The activity stream opens.
 - In the activity stream, find the milestone with an error and open the
activity stream from it using one of the following options.
-
If View payload
 appears on the milestone, click View
payload
 .
. 
-
If View payload
 doesn't appear on the milestone, expand the
milestone by clicking the expand icon
>, and then click
View payload
 for the part of the integration flow that failed.

-
- Review the payload and take the appropriate action.For example, if a 404 error occurred, check the configuration of the connection.
- Hover over an errored integration instance, and select View
details
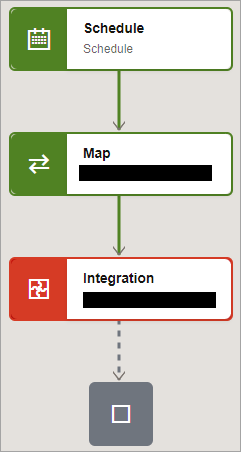
- Optional: To see the error within the integration flow, open the integration
canvas.
- On the Errors page, in the Primary identifier
column, click the name of the primary identifier, such as
Primary: undefined.
The integration canvas appears. The integration component with an error is marked in red.

- To see the error in the activity stream: Point to the component with an
error, click Actions
 , and select Activity stream.
The activity stream opens.
- On the Errors page, in the Primary identifier
column, click the name of the primary identifier, such as
Primary: undefined.
- If you are not responsible for addressing the error, send the error information
to the owner of the integration.For example, you might perform some or all of the following steps:
- Take a screenshot of the activity stream.
- Copy the payload text.
- Download the logs for the activity stream.
Tip:
Click Download Logs at the top of the activity stream.