Monitor the Message Processing Status of Integrations in Projects
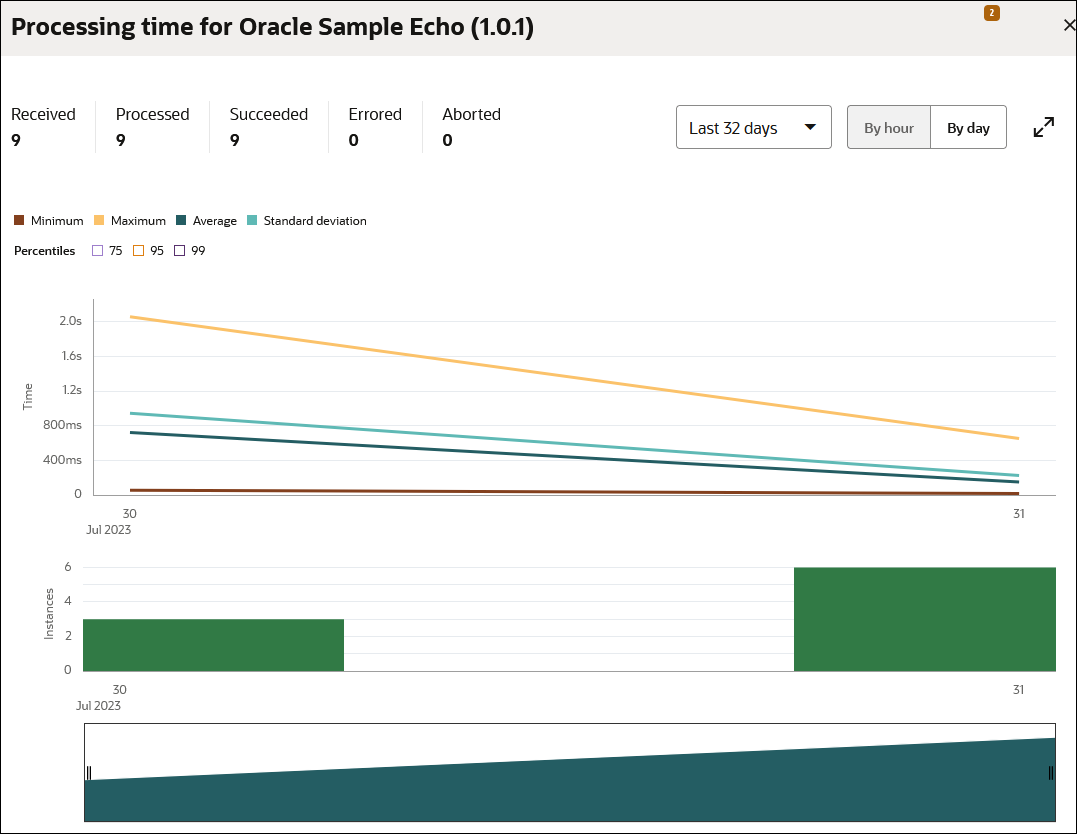
You can view the message processing status of your running integrations in a project, including how many messages have been received and processed, how many successful messages and errors have occurred, and how many messages have been canceled. You can also view aggregated instance metrics for the selected integration.
 .
.
 , then select the time window, integration status (active, configured,
                    activating, failed, or all), and integration style (application, schedule, or
                    event). You can also specify a custom time range to filter the search for
                    integrations under
, then select the time window, integration status (active, configured,
                    activating, failed, or all), and integration style (application, schedule, or
                    event). You can also specify a custom time range to filter the search for
                    integrations under  to show aggregated instance metrics for the selected integration. For
                    information about using the Statistics page, see
 to show aggregated instance metrics for the selected integration. For
                    information about using the Statistics page, see