Test Integrations from Inside the Integration Canvas

You can test REST Adapter trigger connection-based integrations and scheduled integrations from inside the integration canvas in Oracle Integration.

This capability lets you automatically activate your integration with the tracing level set to debug and specify request details from the Run integration panel inside the integration canvas.

This capability simplifies integration testing and eliminates the need to exit the canvas, manually activate the integration, set the tracing level, select Run from the Actions Actions icon menu, and specify the request details as separate steps.
  1. Design your integration.
    When complete, perform the following steps to activate and run your integration.
  2. Click Run test Run integration icon in the integration canvas bar.


    The canvas bar shows eight icons. The Run test icon is the last icon on the right.

    The Test integration panel opens and the following actions are automatically performed:
    • The integration switches to view mode.
    • The integration is activated with the tracing level set to debug.
    • The endpoint details are obtained.


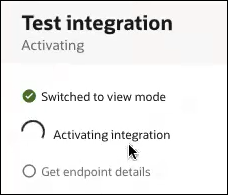
    The Test integration panel shows progress messages for switching to view mode, activating the integration, and getting the endpoint details.

    While activation tasks are in progress, you can perform other actions:
    • Perform actions inside the canvas. For example, you can click Properties Properties icon to view integration properties. When you perform an action inside the canvas, the Test integration panel is closed. To bring back the Test integration panel and continue testing, click Resume icon in the toolbar.
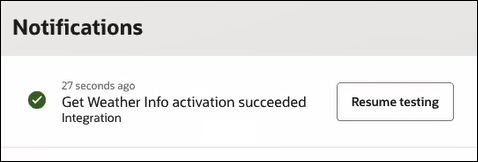
    • Exit the canvas to perform actions. Once activation completes, a message appears in the upper right part of the page.
      Integration_name activation succeeded
      Resume testing

      You can click Resume testing to return to the canvas where you are prompted to specify request values to run the activated integration.

      You can also click Notifications The notifications icon in the Oracle Integration banner, and then click Resume testing to return to the canvas where you are also prompted to specify request values to run the activated integration.


      The Notifications message indicates that the integration activation was successful. A Resume testing button appears.

    If activation fails, the Try again option is enabled in the Test integration panel.

    When these tasks complete, the panel is refreshed to show the following:
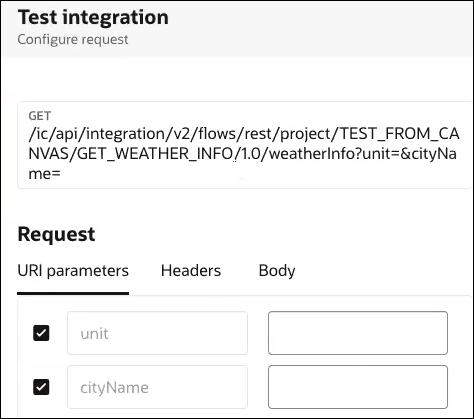
    1. For a REST Adapter trigger connection-based integration, you are prompted to specify request parameter values:


      The Test integration panels shows the Configure request page. The GET setting is displayed. Below this is the Request section with tabs for URI parameters, Headers, and Body. The URI parameters for unit and cityName are shown with blank fields for entering values.

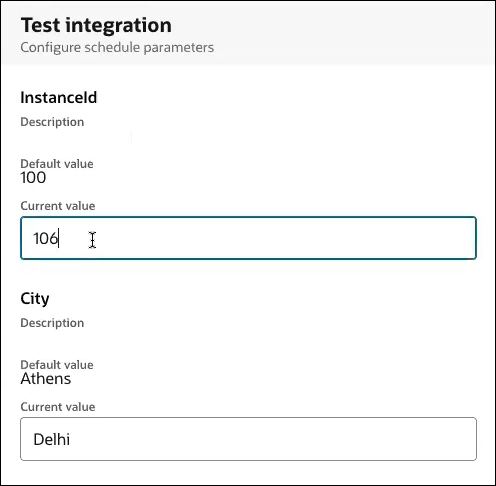
    2. For scheduled integrations with defined schedule parameters, you are prompted to specify values:


      The Test integration panels shows the Configure schedule parameters page. Below this are fields for InstanceId and City. Both include subfields for Description, Default value, and Current value.

    3. For scheduled integrations without defined schedule parameters, no additional input is required. The integration runs automatically after activation and the results/activity stream are displayed.
  3. Specify the request or scheduled parameter details, and click Run.

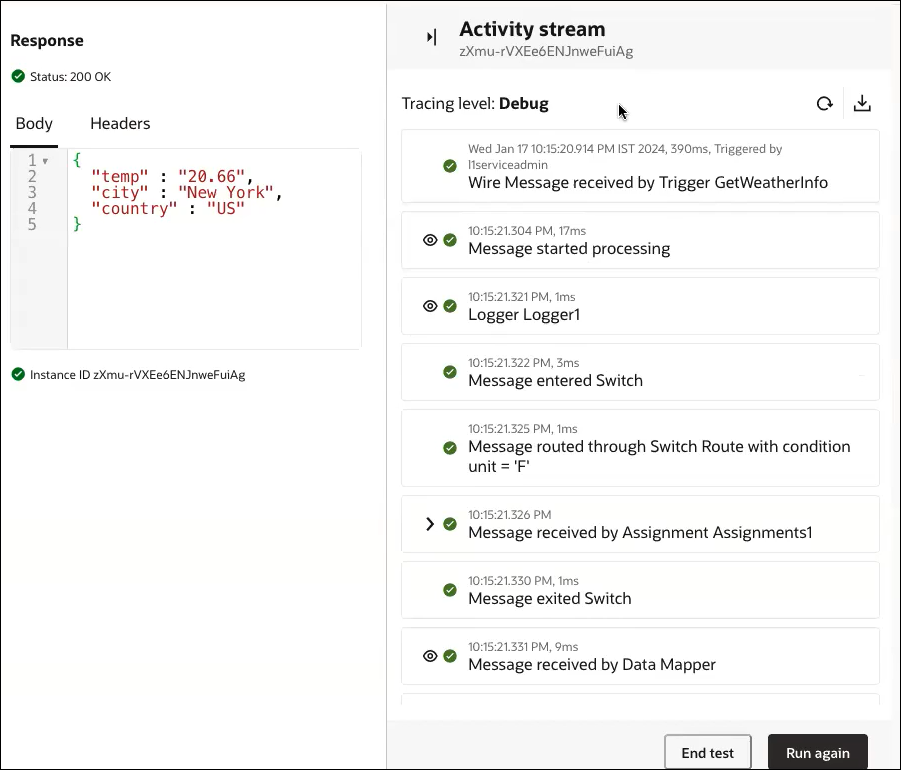
    The response details (for REST Adapter trigger connection-based integrations) and instance ID are first displayed, followed by the activity stream. The integration canvas switches from edit mode to runtime tracking mode.


    The Response section shows a message of Status 200 OK. Below this are tabs for Body (which is selected) and Headers. On the right is the activity stream, which shows the key milestones in the movement of the message through the integration. At the top is the instance ID value and a message indicating that the tracing level is set to debug. On the right are two icons. At the bottom are the End test and Run again buttons.

  4. Perform runtime monitoring details, such as expanding sections of the activity stream, viewing the business identifiers that were passed, tracing the message delivery through the integration, and so on.
  5. If you want to run the integration again, click Run again.
  6. Specify the request or scheduled parameter details again, and click Run.
  7. When testing is complete, click End test at the bottom of the activity stream or End test The end test icon in the integration canvas bar.

    The integration canvas bar shows five icons. The icon on the far right is the End test icon.

    The Test integration panel opens and the following actions are automatically performed:
    • The integration is deactivated.
    • The integration switches back to edit mode.


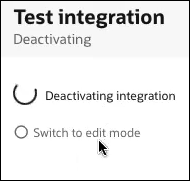
    The Test integration panel shows progress messages for deactivating the integration, and switching to edit mode.