Tour of the Projects Workspace
The Projects workspace contains several tabs for designing, managing, and monitoring automation solutions.
Navigation to the Projects Workspace
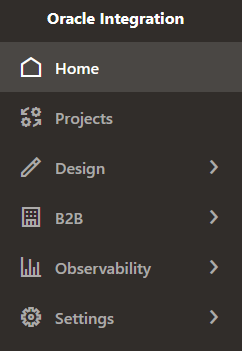
A Projects option is available in the navigation pane.
In the Projects workspace, you can complete all your design, management, and monitoring tasks. You don't need to navigate to the Design and Observability pages when working in a project.

Tip:
When you move around the project workspace performing tasks, a BackDesign Tab
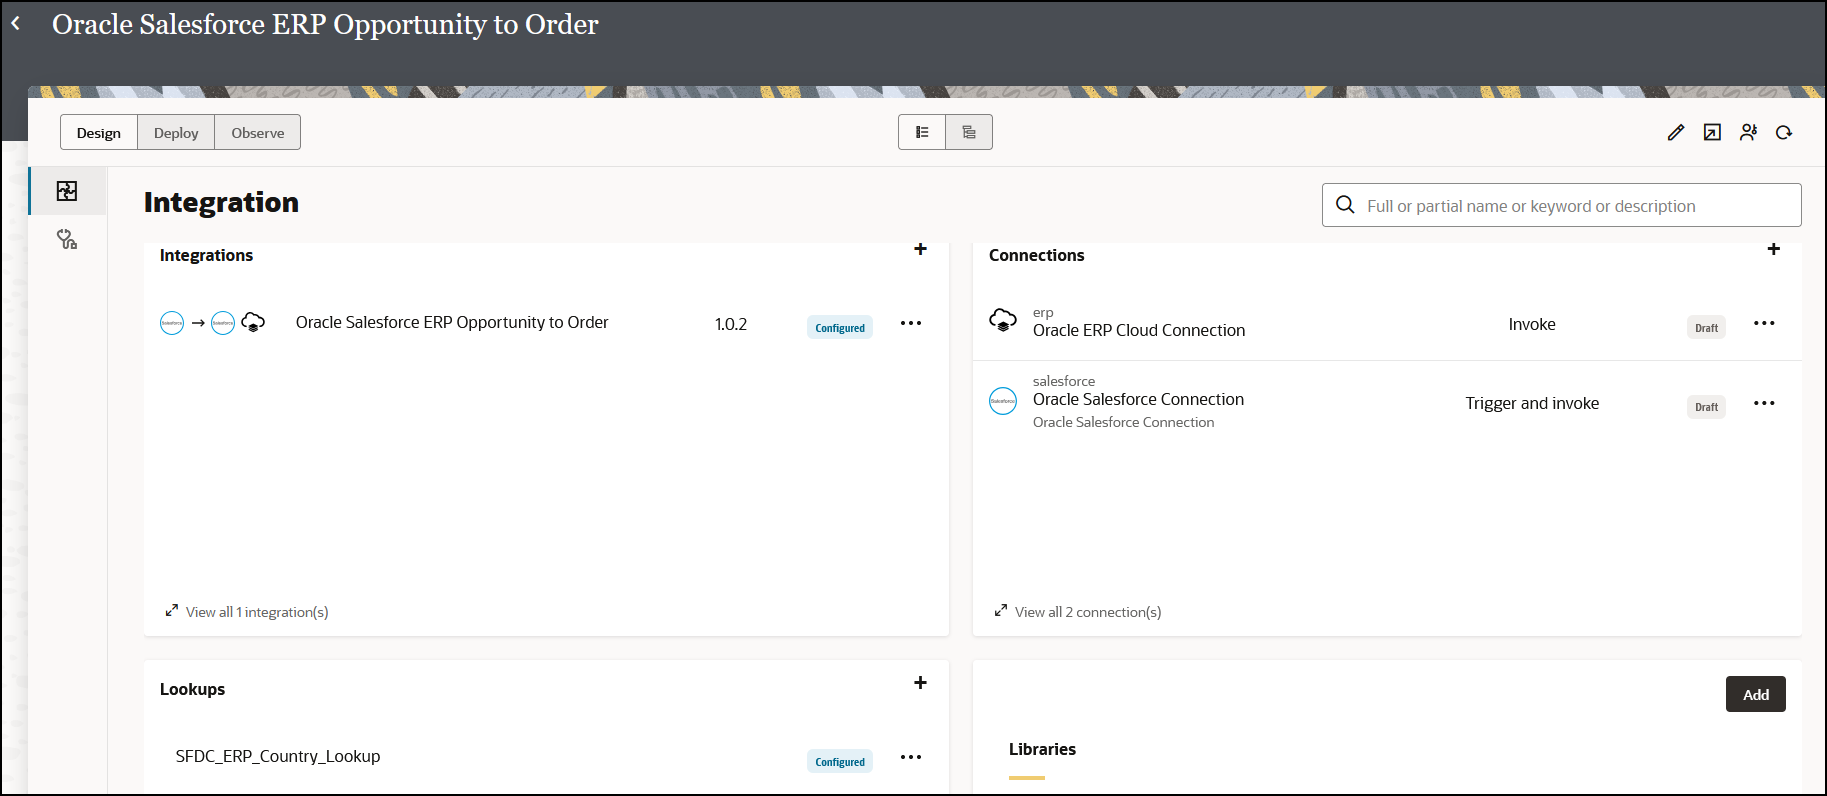
Design and manage integrations on the Design tab, which appears by default when you open a project. The design tab includes a vertical navigation bar to navigate among the pages.

The Design tab contains the following pages.
Integration Page
The following components are available on the Integration ![]() page on the Design tab.
page on the Design tab.
| Component | Description |
|---|---|
|
Integrations section |
Create integrations in this section. Additional tasks that you perform in this section
include:
|
|
Connections section |
Create connections for your integrations in this section. Additional tasks that you perform in this section
include:
|
|
Lookups section |
Create lookups for your integrations in this section. Additional tasks that you perform in this section include editing, deleting, and searching for lookups. |
|
Libraries section |
Create JavaScript libraries for your integrations in this section. Additional tasks that you perform in this section include deleting, updating, and searching for libraries. |
|
Events area |
Create events to publish and subscribe to in integrations. Additional tasks that you perform in this section include cloning, editing, deleting, and viewing events. |
Robot Page
The following components are available on the Robot ![]() page on the Design tab.
page on the Design tab.
For information about working with robots and their components, see Learn About Robots and Build a Robot in Using Robots in Oracle Integration 3.
| Component | Description |
|---|---|
|
Robots section |
Create and edit robots, create new versions of robots, associate and remove environment pools, activate and deactivate robots, delete robots, and more in this section. |
|
Environment pools section |
Create and edit environment pools, add and remove environments from the pools, and more in this section. |
|
Robot connection types section |
Create, edit, and delete robot connection types in this section. |
|
Robot connections section |
Create, edit, and delete robot connections in this section. |
Human in the Loop Page
The following components are available on the Human in the loop ![]() page on the Design tab.
page on the Design tab.
| Component | Description |
|---|---|
|
Workflows section |
Create and edit workflows, create new versions of workflows, manage data in workflows, activate and deactivate workflows, delete workflows, and more in this section. |
|
Forms section |
Create and edit forms, work with form controls, create new versions of forms, activate and deactivate forms, delete forms, and more in this section. |
Healthcare Page
The following components are available on the Healthcare ![]() page on the Design tab.
page on the Design tab.
| Component | Description |
|---|---|
|
HL7 messages and schemas |
Create HL7 messages and schemas in this section. See Create Oracle Integration for Healthcare Schemas and Documents in Using Oracle Integration for Healthcare in Oracle Integration 3. Additional healthcare-related tasks that you can perform
include:
You can select the HL7 message when configuring the healthcare action in an integration in the Integrations section of the project. See Convert HL7 Messages with a Healthcare Action in Using Oracle Integration for Healthcare in Oracle Integration 3. |
B2B Page
The following components are available on the B2B ![]() page on the Design tab.
page on the Design tab.
| Component | Description |
|---|---|
|
Documents and schemas |
Create or import documents and schemas in this section. See B2B Schemas and B2B Documents in Using B2B for Oracle Integration 3. Additional B2B for Oracle Integration-related tasks that you can perform include:
You can select the document when configuring the B2B action in an integration in the Integrations section of the project. See Use the B2B Action in Standalone Mode in Using B2B for Oracle Integration 3. |
|
Trading partners |
Create or import trading partners in this section. You can also edit, view, export, and delete trading partners. See Use B2B for Oracle Integration in Trading Partner Mode in Using B2B for Oracle Integration 3. |
Not all B2B features are currently supported in projects. See Design B2B Integrations in Projects or in Standalone Environments.
Components on All Pages
Some components are available on all pages in the Design tab.
| Component | Description |
|---|---|
| View dependencies |
View the dependent relationships between all integrations, connections, lookups, JavaScript libraries, and events in a project. |
|
Edit details |
View integration description details. |
| Export |
Export a project. |
|
Share |
Assign a project owner and specify the people who can edit, view, and monitor resources in the project. |
|
Refresh
|
Refresh the area you are in separately from other areas (for example, healthcare). |
Deploy Tab
Deploy one or more automation solutions in a project on the Deploy tab.

The Deploy tab contains the following components:
| Component | Description |
|---|---|
|
Create button |
Create a project deployment. |
|
Options that appear when you point to a project deployment |
Contains options for exporting, activating, and deactivating a project deployment. |
|
Actions
|
Contains options for editing, viewing, cloning, and deleting a project deployment. |
Observe Tab
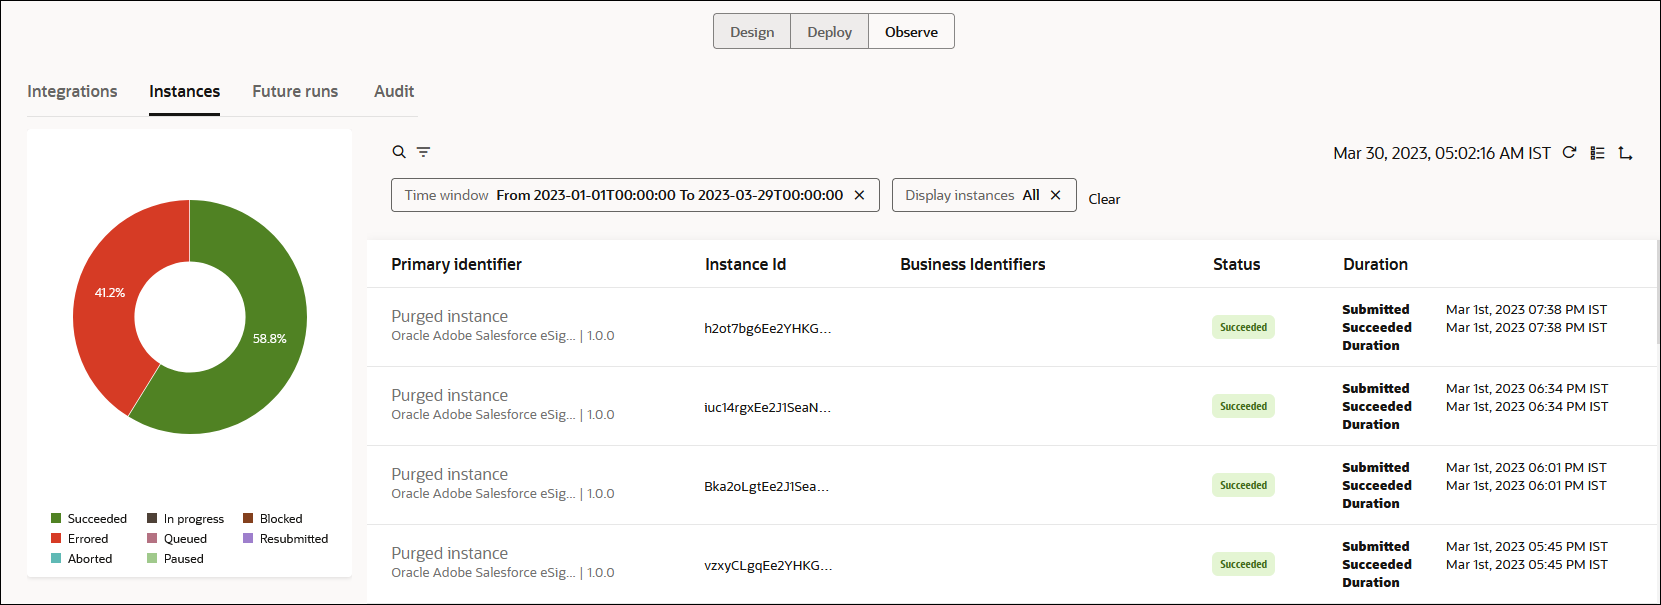
Monitor your automation solutions on the Observe tab.

The Observe tab contains the following pages.
Integration Page
The following tabs are available on the Integration ![]() page on the Observe tab.
page on the Observe tab.
| Tab | Description |
|---|---|
|
Integrations tab |
See high-level information about your integrations and their messages. |
|
Instances tab |
This tab contains the following components:
|
|
Subscriptions tab |
Shows the currently subscribed integrations, the event, retained events, and subscriber status. |
|
Future runs tab |
View a calendar of scheduled integration runs. |
|
Audit tab |
View and download the design-time audit log of actions performed in a project. |
Robot Page
The following tabs are available on the Robot ![]() page on the Observe tab.
page on the Observe tab.
| Tab | Description |
|---|---|
|
Robot instances tab |
This tab contains a table for tracking the status of robot instances through business identifiers and viewing the activity stream and message payloads of an instance. Use a clickable graph to filter the display of the state of instances. You can also use the Filter
|
Human in the Loop Page
The following tab is available on the Human in the loop ![]() page on the Observe tab.
page on the Observe tab.
| Tab | Description |
|---|---|
|
Workflow instances tab |
This tab contains a table for tracking the status of workflow instances and viewing the activity stream and message payloads of an instance. You can either use the search icon |
B2B Page
The following tabs are available on the B2B ![]() page on the Observe tab.
page on the Observe tab.
| Tab | Description |
|---|---|
| Business messages |
This tab contains the following components:
|
| Wire messages |
This tab contains the following components:
|