Before you Begin
The support for OpenTracing, an API and vendor-neutral instrumentation framework, allows application developers to instrument their application code and analyze the trace data in Oracle Cloud Infrastructure (OCI) Application Performance Monitoring (APM). This is an example of instrumentation of Python code.
Background
Distributed tracing is a method used to profile and monitor applications. This method is especially used to monitor applications built using a microservices architecture. OpenTracing is an open-source project that provides vendor-neutral APIs and instrumentation for distributed tracing. It allows developers to add instrumentation to their application code using APIs.
Application Performance Monitoring consumes telemetry data collected by OpenTracing and provides information on requests, through various microservices or functions. Therefore, APM allows real end user monitoring and complete analysis of the impact of services on the overall end-user digital experience.Our Scenario
In this example, we have two Python programs deployed on Kubernetes. One program gets a video from the OCI Object Storage and puts it into Kafka, the other one gets the video from Kafka and analyzes the video. APM supports the Zipkin distributed tracing system, so our Python code is instrumented using Zipkin. Let's see how it is done!
Step 1: Import the Tracer Initialization Code
For Python applications, py_zipkin provides a context manager/decorator along with some utilities to facilitate the usage of Zipkin. First, you import a customized py_zipkin, the tracer initialization code, into your Python code. Note the changes for this scenario are shown in bold below:
from py_zipkin import Encoding #import Zipkin package
from py_zipkin.zipkin import zipkin_span #import Zipkin package
from transport import http_transport #import Zipkin transport
def send_video():
#Initiate Zipkin tracer client on your python code that you want to trace
with zipkin_span(
      service_name="start download file from object storage", #You can change it as you need
      span_name="loop download file", #You can change it as you need
      transport_handler=http_transport, #zipkin transport, will use it to upload trace data to OCI APM
      encoding = Encoding.V2_JSON,
      binary_annotations = {"send_video":"customer message"}, #Custom tag
      sample_rate=100 # this is optional and can be used to set custom sample rates
  ):
    result = download_file(namespace, "bucket-version", "sample_video.mp4")
Step 2: Add the Zipkin Span Annotations
- Add the first annotation. The annotation is shown in bold for our example:
from py_zipkin import Encoding #import Zipkin package from py_zipkin.zipkin import zipkin_span #import Zipkin package from transport import http_transport #import Zipkin transport #This is the Zipkin span annotation used to trace “download file from object storage” and upload this trace data to OCI APM @zipkin_span(service_name='start download file from object storage', span_name='download file method') def download_file(self, namespace_name, bucket_name, object_name): try: objectStorageClient = self.connect_oracleObjectStorage() #download video from object storage download_file = objectStorageClient.get_object(namespace_name, bucket_name, object_name) params = download_file.data.content #send video to kafaka self.producer.senddata(params) except Exception: return False return True - Add the second annotation:
from py_zipkin import Encoding #import Zipkin package
from py_zipkin.zipkin import zipkin_span #import Zipkin package
from transport import http_transport #import Zipkin transport
#This is the Zipkin span annotation used to trace “send video to kafka” and upload this trace data to OCI APM
@zipkin_span(service_name='start download file from object storage', span_name='send video to kakfa')
def senddata(self, params):
    try:
        parmas_message = params
        producer = self.producer
        producer.send(self.kafkaTopic, value=parmas_message)
        producer.flush()
    except KafkaError as e:
        print(e)
Step 3: Create an APM Domain
- Sign in to the Oracle Cloud Infrastructure console, open the navigation menu, and click Observability and Management. Under Application Performance Monitoring, click Administration:
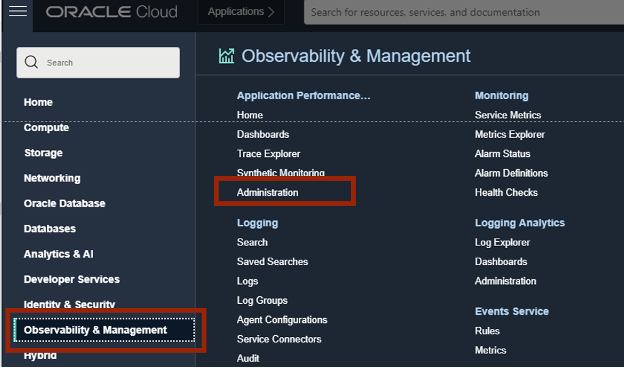
Description of the illustration apm.png - Click Create APM Domain:
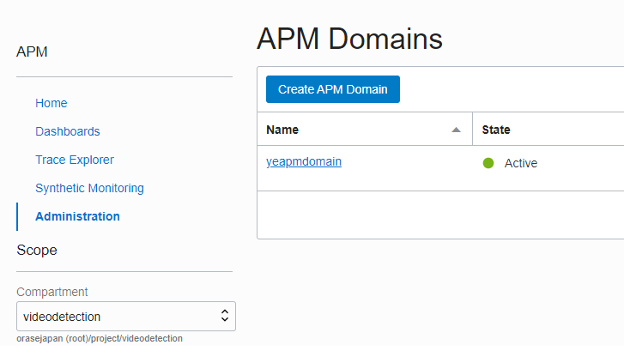
Description of the illustration domain.png - Enter the domain details:
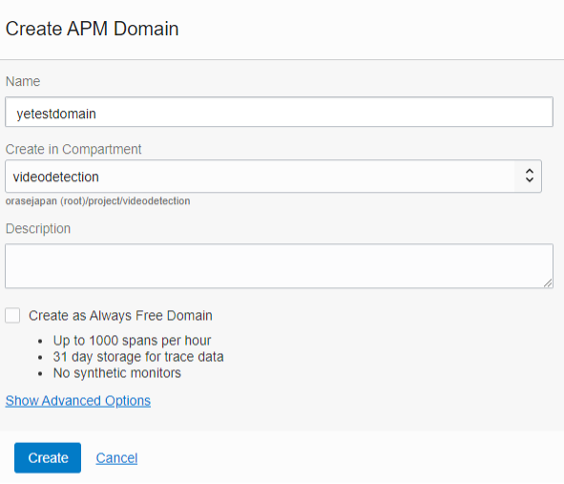
Description of the illustration create.png - Click on the domain you just created and make a note of the domain values Data Upload Endpoint, Private Key and Public Key:
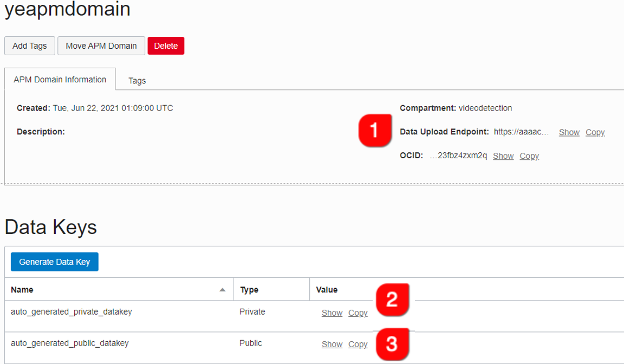
Description of the illustration domain_details.png
Step 4: Configure the Zipkin Transport for Python
- Construct the URL required to send data to APM. The format of the URL is:
apm-domain-short-id.apm-collector-domain.apm-domain-short-id.apm-collector-domain/API version/observations/observationType?dataFormat=dataFormat&dataFormatVersion=dataFormatVersion&dataKey=dataKeyFor this example, the root of the URL is:https://xyz.apm-agt.ap-abc.oci.oraclecloud.comand the datakey is:
XXXXXXXXTZOZBR3XE4GJRXYZ - Add the complete URL to your code:
import requests
def http_transport(encoded_span):
      requests.post(
             #Construct a URL that communicate with Application Performance Monitoring
             'https://xyz.apm-agt.ap-abc.oci.oraclecloud.com/20200101/observations/public-span?dataFormat=zipkin&dataFormatVersion=2&dataKey=XXXXXXXXTZOZBR3XE4GJRXYZ',
        data=encoded_span,
        headers={'Content-Type': 'application/json'},
    )
Step 5: View Data in Trace Explorer
You are now ready to view and analyze your trace data in APM Trace Explorer. When your Python program runs, the Zipkin Client will start sending trace data that will in turn be uploaded to APM. Take a look at how this data looks in APM.
- From the OCI main menu, navigate to Trace Explorer:
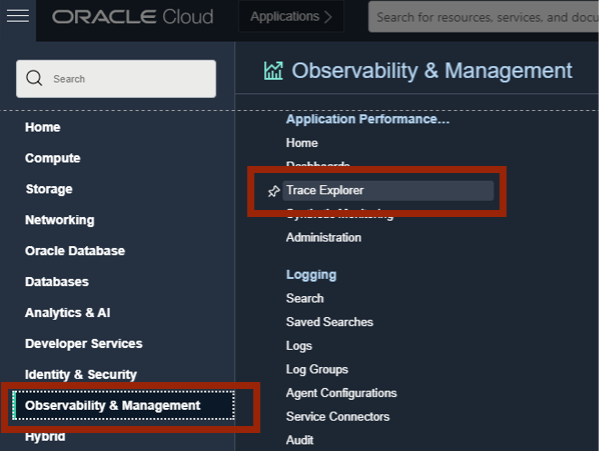
Description of the illustration trace.png - Select your compartment and domain and view all trace data, under the Traces tab:
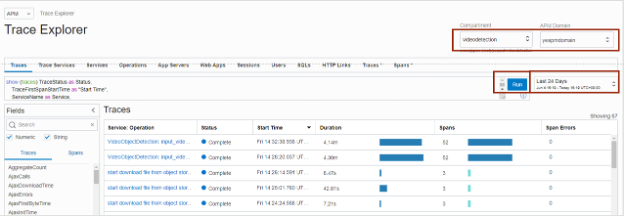
Description of the illustration traceexplorer.png - Click on any trace to view more details about it:
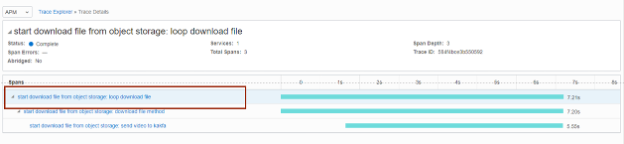
Description of the illustration tracedetails.png - Click on Span to view more details and tagged values:
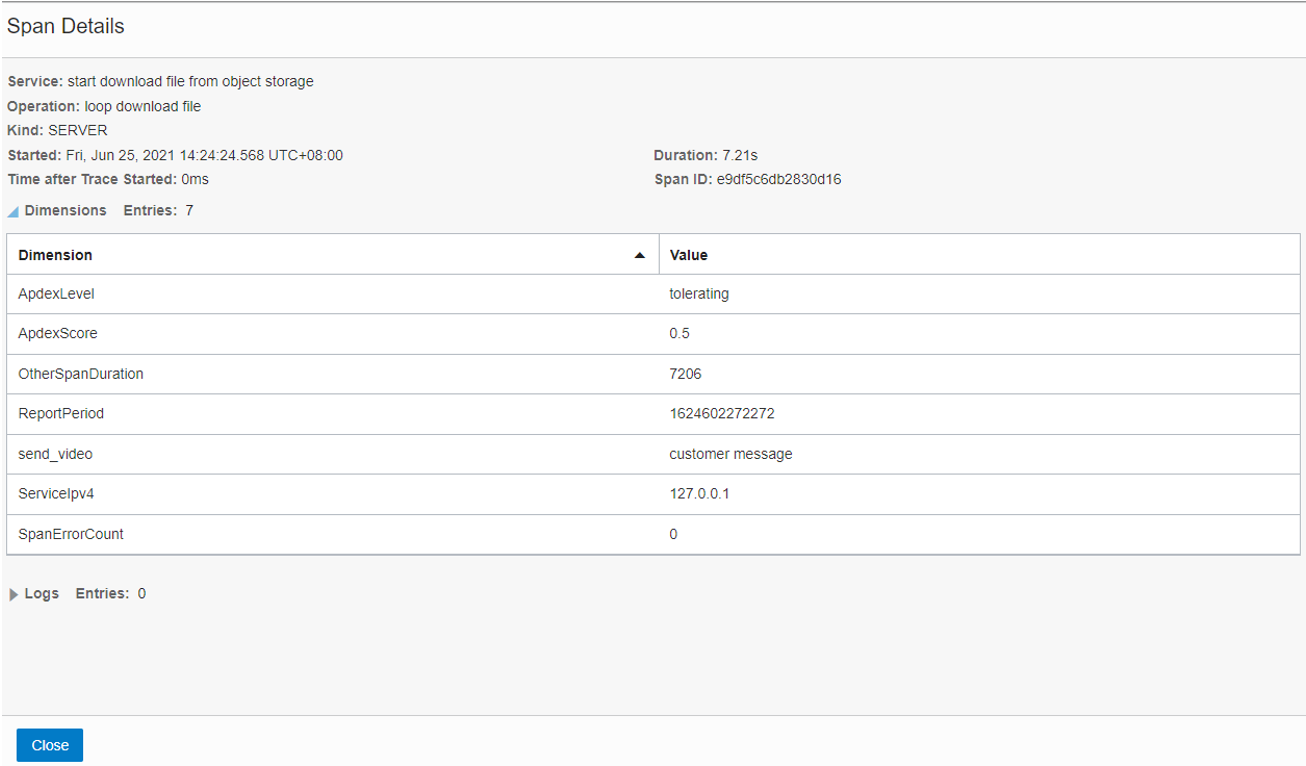
Description of the illustration span.png
In this example, the trace data shows that the Python application spent 7.21 seconds in getting the video file, 7.21 seconds downloading the file and 5.5 seconds in sending the video file to Kafka. Based on this data, you can determine if this is the best experience for your user.
Note the send_video tag that was defined on Zipkin tracer Client. (binary_annotations)
Learn More
Application Performance Monitoring: Instrumenting Python Applications I
F45326-01
July 2021
Copyright © 2021, Oracle and/or its affiliates.
This tutorial shows an example of Python code distributed tracing instrumentation.
This software and related documentation are provided under a license agreement containing restrictions on use and disclosure and are protected by intellectual property laws. Except as expressly permitted in your license agreement or allowed by law, you may not use, copy, reproduce, translate, broadcast, modify, license, transmit, distribute, exhibit, perform, publish, or display any part, in any form, or by any means. Reverse engineering, disassembly, or decompilation of this software, unless required by law for interoperability, is prohibited.
If this is software or related documentation that is delivered to the U.S. Government or anyone licensing it on behalf of the U.S. Government, then the following notice is applicable:
U.S. GOVERNMENT END USERS: Oracle programs (including any operating system, integrated software, any programs embedded, installed or activated on delivered hardware, and modifications of such programs) and Oracle computer documentation or other Oracle data delivered to or accessed by U.S. Government end users are "commercial computer software" or "commercial computer software documentation" pursuant to the applicable Federal Acquisition Regulation and agency-specific supplemental regulations. As such, the use, reproduction, duplication, release, display, disclosure, modification, preparation of derivative works, and/or adaptation of i) Oracle programs (including any operating system, integrated software, any programs embedded, installed or activated on delivered hardware, and modifications of such programs), ii) Oracle computer documentation and/or iii) other Oracle data, is subject to the rights and limitations specified in the license contained in the applicable contract. The terms governing the U.S. Government's use of Oracle cloud services are defined by the applicable contract for such services. No other rights are granted to the U.S. Government.
This software or hardware is developed for general use in a variety of information management applications. It is not developed or intended for use in any inherently dangerous applications, including applications that may create a risk of personal injury. If you use this software or hardware in dangerous applications, then you shall be responsible to take all appropriate fail-safe, backup, redundancy, and other measures to ensure its safe use. Oracle Corporation and its affiliates disclaim any liability for any damages caused by use of this software or hardware in dangerous applications.
Oracle and Java are registered trademarks of Oracle and/or its affiliates. Other names may be trademarks of their respective owners.
Intel and Intel Inside are trademarks or registered trademarks of Intel Corporation. All SPARC trademarks are used under license and are trademarks or registered trademarks of SPARC International, Inc. AMD, Epyc, and the AMD logo are trademarks or registered trademarks of Advanced Micro Devices. UNIX is a registered trademark of The Open Group.
This software or hardware and documentation may provide access to or information about content, products, and services from third parties. Oracle Corporation and its affiliates are not responsible for and expressly disclaim all warranties of any kind with respect to third-party content, products, and services unless otherwise set forth in an applicable agreement between you and Oracle. Oracle Corporation and its affiliates will not be responsible for any loss, costs, or damages incurred due to your access to or use of third-party content, products, or services, except as set forth in an applicable agreement between you and Oracle.