About the Graph Visualization Legend Panel
Learn about the graph visualization legend panel when viewing the results of the query in graph format.
The graph visualization legend panel appears on the right of the graph visualization panel and displays the legend items that represent vertices and edges of the graph, vertex and edge captions, and customized vertex and edge styles. The following figure shows a sample legend panel:
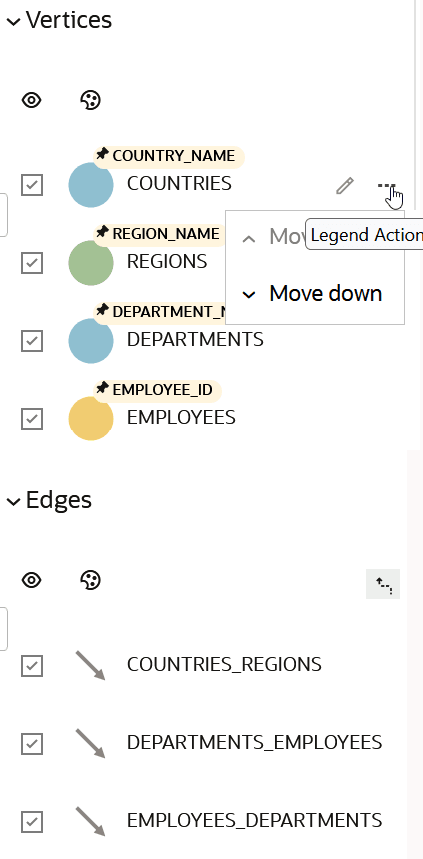
Description of the illustration explorer_legend_panel.png
You can perform the following actions in the legend panel:
-
Edit the style of a legend item.
You can configure the size, color, caption, icon (for vertex only), and animations for a legend item.
-
Reorder the legend items by dragging and dropping them, or by selecting Move up or Move down from the action menu for a legend item.
-
Enable or disable a style by clicking on the legend item symbol.
-
Enable or disable the visibility of the vertices or edges using the visibility checkbox.
-
Enable or disable the
 option in the Edges legend region to choose how hidden elements are handled.