Use Graph Server Dashboard
The Graph Server Dashboard helps you monitor graph server memory usage, active sessions, graphs in memory, and graph-loading progress.
You can access the Graph Server Dashboard from the main navigation menu. To use the dashboard, Graph Studio must be attached to the internal compute environment.
Graph Server Dashboard contains the following three tabs:
- Memory Usage
- Sessions
- Graphs
Memory Usage
The Memory Usage tab provides in-depth information on the amount of memory used by the graph server. You can view data charts on real-time memory usage, study the current memory consumption patterns and identify any potential issues.
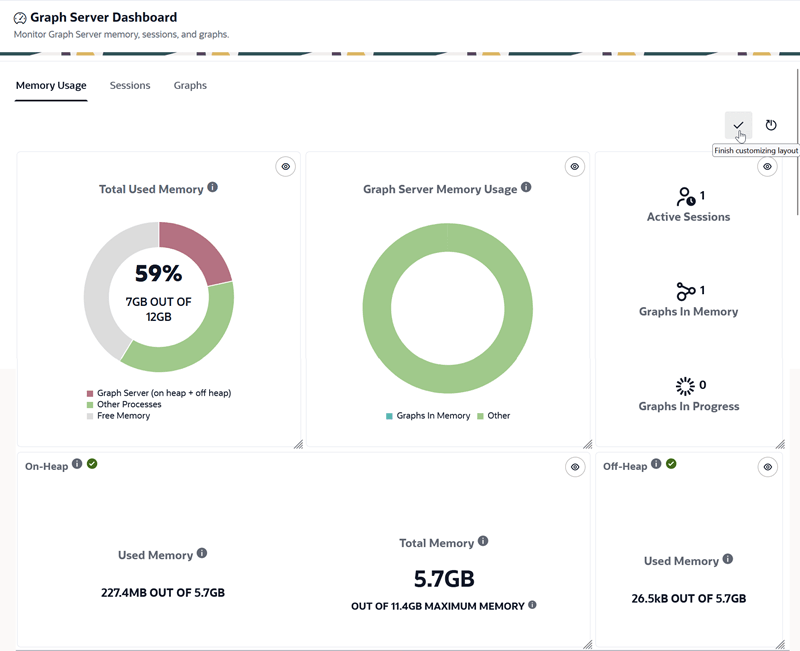
Description of the illustration memory_usage_db.png
The dashboard displays the following sections:
-
Total Used Memory: This chart displays the total memory usage at the system level. It shows the memory consumption by the graph server (sum of on-heap and off-heap memory) and other processes. You can also view the available amount of free memory.
-
Graph Server Memory Usage: This chart displays the memory consumed by graphs that are loaded into the graph server and also the memory usage for other graph operations such as loading graphs, running graph algorithms and so on.
-
On-Heap: This section provides the following details:
-
Used Memory: This displays the on-heap memory used currently by the graph server.
-
Total Memory: This displays the total of used memory and free memory.
-
-
Off-Heap: This displays the off-heap memory used currently by the graph server.
-
Active Sessions: Number of active sessions.
-
Graphs In Memory: Number of graphs loaded into memory.
-
Graphs In Progress: Number of graphs that are being loaded into memory.
To customize the Memory Usage dashboard panel layout, click the Customize layout icon in the page header. You can then:
- Rearrange a panel by dragging it to the required location.
- Resize a panel by dragging the resize handle in its lower-right corner.
- Hide a panel by clicking the eye icon in its upper-right corner.
- Restore the default arrangement by clicking the reset icon in the page header.
Once you finish editing, click the check mark icon in the page header. Your customized layout is saved in the browser.
Sessions
The Sessions tab displays the active user session.
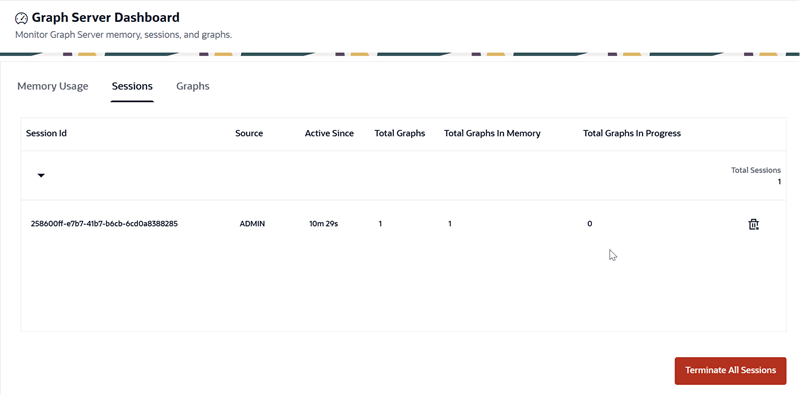
Description of the illustration sessions_db.png
Note that each session in Graph Studio uses its own graph server resources.
You can view your current session details. Optionally, you can terminate your session.
Graphs
The Graphs tab displays the total memory usage for each graph.
You can select one of the following options:
-
Graphs In Memory: Displays graphs that are loaded into memory. This is the default option.
-
Graphs In Progress: Displays graphs that are being loaded into memory.
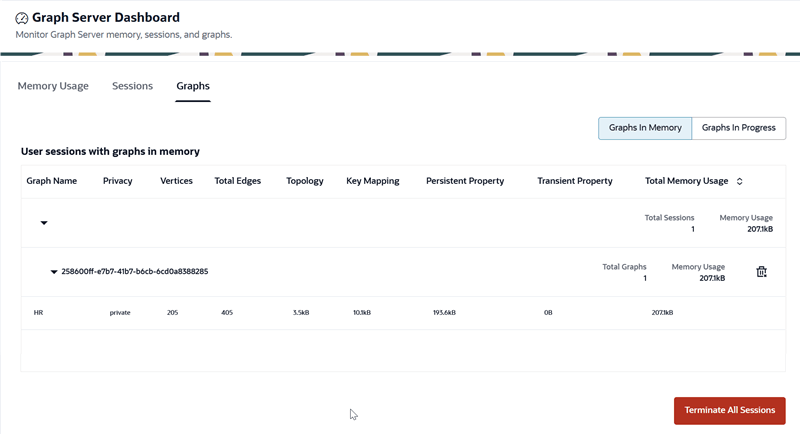
Description of the illustration graphs_db.png
You can view the memory usage for the graphs referenced by your current session. You can also terminate graphs associated with your current session.