Perform Data Analysis using Spreadsheet Add-ins
Use Data Analysis to analyze data in Oracle Autonomous AI Database from a spreadsheet.
You can run queries on the following types of data from the database and view them in different formats.
-
AV (Analytic View)
-
Table
-
View
-
Catalog
You can run custom SQL queries, add calculated measures, and retrieve data using a faceted search capability on specific columns. You can dynamically apply filters to query results and view the data in the sheet. You can query Analytic Views and select measures, hierarchies, and levels from the query.
The Data Analysis Panel
The Data Analysis panel contains the following:
-
Base Query: Specifies the source for the data that you want to analyze. The Base Query panel provides different layouts for Tables/Views, Analytic Views, and Catalog, with options specific to each data source.
Load Analysis provides reports and helps you explore and visualize the loaded data set.
-
Visualization: Determines how query results are displayed in the worksheet. You can view all columns specified in the base query and display the result as a table, pivot, or chart.
-
Filters: Provides filtering options for column values and displays them as visual representation or as text while applying filters.
You can select Autorun SQL to update the query and the data visualization or the filters automatically in the worksheet.
Run Queries from Data Analysis
Note: Connect to your database from a spreadsheet to use the features of the add-in.
-
Start Microsoft Excel or Google Sheets and open a workbook.
-
From the Oracle Database menu select Data Analysis.
-
The Data Analysis panel opens Base Query and displays all tables and columns for the schema by default.
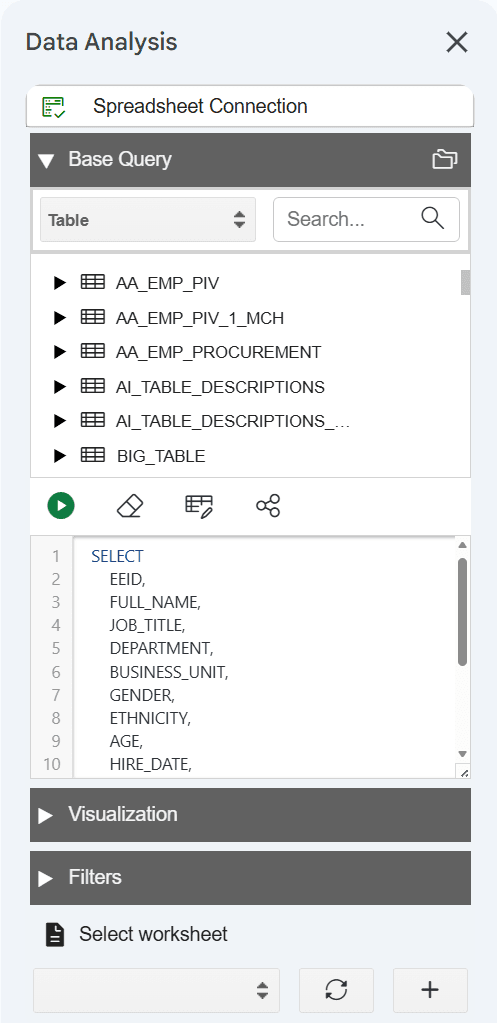
Description of the illustration data-analysis-1-base-query.png
The query written in the SQL editor is the Base Query. You can use the Search field to find and select objects from the database.
-
Select the object or columns that you want to include in the query.
You can drag and drop a column or the entire table to the query area to create a
SELECTquery for the columns or the table. -
Review the SQL query generated in the query editor. You can edit the query in this box.
-
The first button below Base Query, a circle with a triangle in it, is the Run button. Click this button to run the custom query.
The add-in displays data from your query result in the selected sheet. You can make changes to the query, such as update the columns and click Run again to refresh the data.
Similarly, use the drop-down in Base Query to select AV (Analytic View), View, or Catalog and run queries against the selected object. With Analytic View, you can select measures, hierarchies, and levels, add filters and calculated measures, and view the result in the worksheet.
While retrieving data from an Analytic View, you can create a custom query, for example select specific hierarchies and select calculations. The add-in configures your query and returns the result in the worksheet.
Visualize Query Results
Use this option to select the format for query results in the worksheet. The box below Visualization displays all columns from the base query. It provides the following modes:
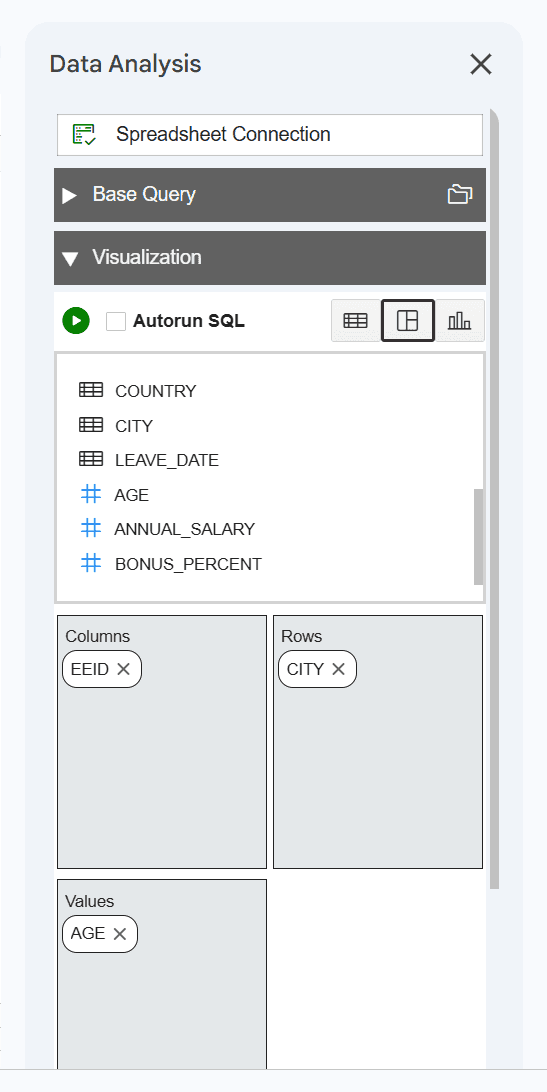
Description of the illustration data-analysis-2-visualization.png
-
Table: The Table mode is selected by default. You can view the SQL results in tabular format. When you select this view, a Columns area appears for selecting rows, enabling you to drag and drop columns of the base query. Moving the selected columns in this box allows you to view only those columns in the result data generated in the worksheet. Click the cross mark for a column name to remove it from the result.
-
Pivot: Use this option to view query results in a pivot table format. You can drag and drop columns from the table in the base query into the Columns, Rows, and Values areas to organize and display worksheet data as a pivot table. You can also transpose rows and columns to change the layout of the pivot table. A pivot table can summarize, sort, reorganize, count the total and perform an average of the result data.
Note: You can select columns with only numeric values for the Values area.
-
Chart: You can select Bar Chart, Area Chart, Line Chart, or Pie Chart and display the query result in chart format. You can select the following options for a chart:
-
Chart Orientation: You can select horizontal and vertical orientation.
-
X-Axis and Values (Y-Axis): You can drag and drop columns from the table in the Base Query to these areas and enter labels for X axis and Y axis.
Note: You can select columns with only numeric values for the Values (Y-Axis) area.
-
Use Aggregate Functions for Numeric Columns
For numeric columns you can use aggregate functions, such as SUM, MIN, MAX, AVG, COUNT, and DISTINCT COUNT. Click a numeric column name to open the list of Aggregation functions. For example, to calculate the average of a sales value, click the column name Sales under Values and select Average from the list of Aggregation functions.
Note: Numeric columns are indicated by a hash (#) before the column name.
Apply Filters
Use the Filters section to narrow the query result. Data Analysis generates a filter for each value in the column retrieved from the query result.
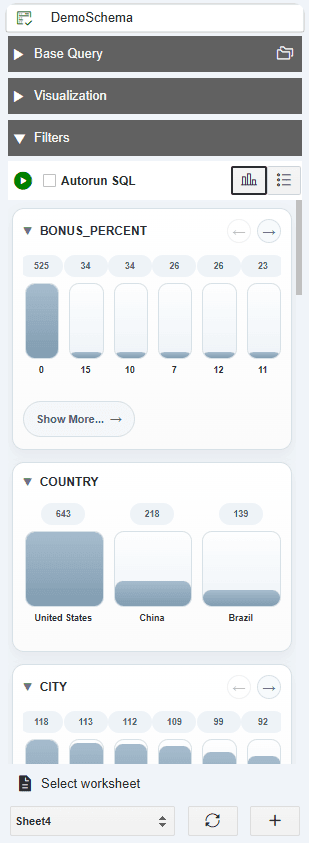
Description of the illustration data-analysis-3-filters.png
The Filters section includes two types of filters:
-
Faceted Visual: Displays the filters as visual representation.
-
Faceted List: Displays the filters as text.
You can filter different columns on the faceted filter panel and view only specific data from the results in the worksheet. For example, to view the customer reports by Region, click the Faceted Filter and select Asia under Region_ID.
Filters work instantly on the query results in the worksheet.