Query Data with SQL Worksheet
Use SQL Worksheet to explore database objects, run SQL, interpret query results, and generate AI-assisted queries from natural language.
Before You Begin
Ensure that:
-
You selected or connected to an Autonomous AI Database.
-
Your database user has permission to query the objects that you want to use.
-
The selected database shows Connected in the SQL Worksheet header.
-
An AI Profile is ready if you want to generate SQL from natural language.
Browse SQL Worksheet
On the Data Studio home page:
-
Open the SQL Worksheet card or select SQL Worksheet in the left navigation. If prompted, connect to a database by entering a database user name and password.
SQL Worksheet includes Catalog and Worksheets tabs so that you can browse database objects while you work with queries.
-
Enter your query in the editor.
-
Click Run SQL to execute the query.
Query a Table or View from Catalog
The Catalog tab is useful when you want to find a table before writing a query.
-
In SQL Worksheet, open the Catalog tab.
-
Expand the connected database and schema.
-
Click the table or view to enter the query. You can also manually write or edit queries in the editor.
-
Click Run SQL to execute the query.
View Query Result
After you run the query, you can view the result and related details in the results panel:
-
Query Result: Displays the returned data.
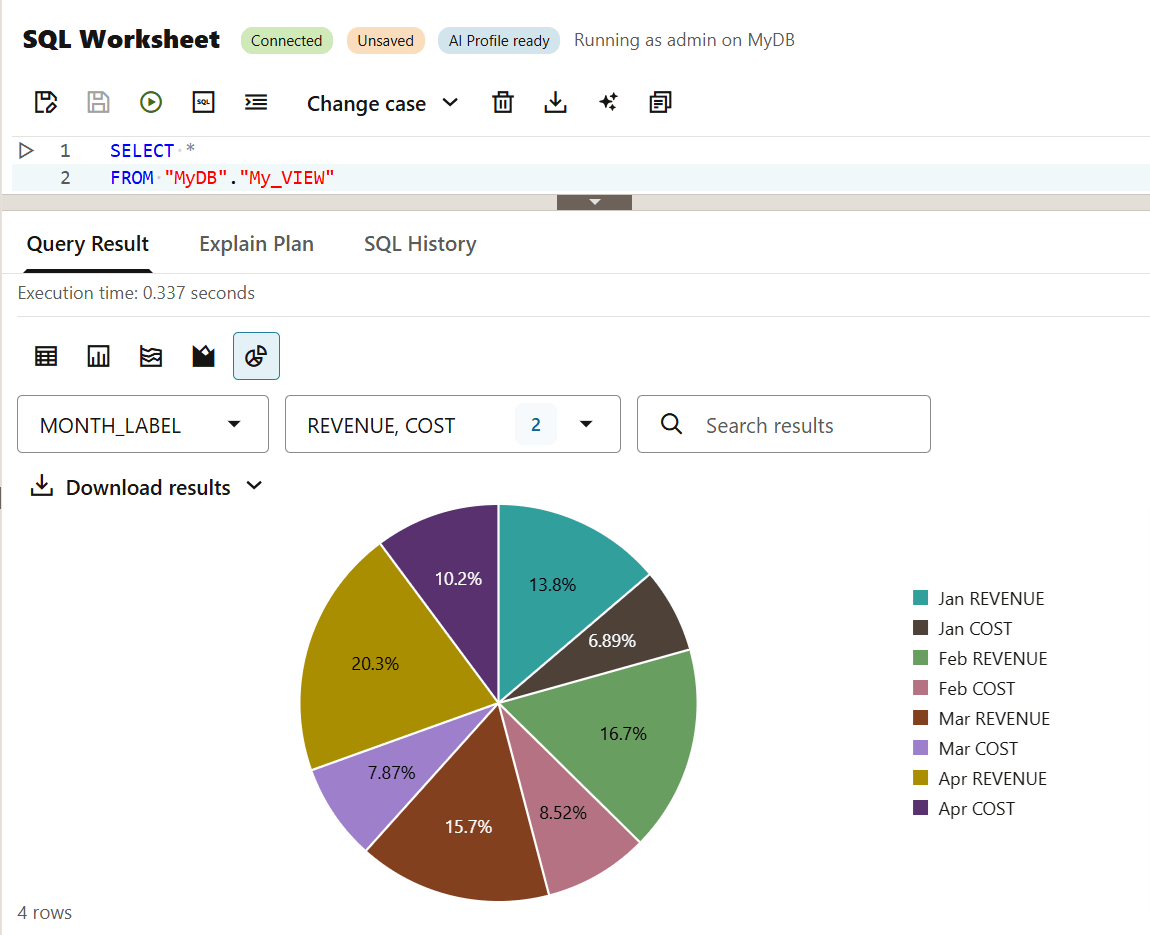
The result area can provide a table view, a search field, a download action, and visualization options when the result can be charted. It also provides additional details, such as execution time and row count.
Click Download results to save the returned data in CSV, JSON, XML, or plain text format for offline reference and analysis.
-
Explain Plan: Runs explain plan to inspect the query plan.
-
SQL History: Records the previously run SQL statements. You can insert the same query in the editor or rerun it directly.
Visualize Query Results
SQL Worksheet can display supported query results as charts or graphs. Select a visualization option in the result toolbar, then select the columns and settings that you want to use.
For more information, see The SQL Page.
Parent topic: Discover and Manage Data