Analyze Data with Oracle Big Data Manager Notebook
 Before You
Begin
Before You
Begin
In this 10-minute tutorial, you learn how to view, manipulate, and analyze HDFS data in Oracle Big Data Manager Notebook.
Background
This is the second tutorial in the Work with Oracle Big Data Manager series. Read them sequentially.
- Copy Data from an HTTP(S) Server with Oracle Big Data Manager
- Analyze Data with Oracle Big Data Manager Notebook
- Create a Personal Dashboard in Oracle Big Data Manager
What Do You Need?
- Access to either an instance of Oracle Big Data Cloud Service or to an Oracle Big Data Appliance, and the required login credentials.
- Access to Oracle Big Data Manager, on either an instance of Oracle Big Data Cloud Service or on an Oracle Big Data Appliance, and the required sign in credentials. A port must be opened to permit access to Oracle Big Data Manager, as described in Enabling Oracle Big Data Manager.
- Read/Write privileges to the
/user/demoHDFS directory. - Basic familiarity with HDFS, Spark, and optionally, Apache Zeppelin.
 Analyze the Loaded Data in Oracle Big Data Manager Notebook
In this section, you import a note into Oracle Big Data Manager Notebook. This note contains several paragraphs that reference the .csv data files that you copied into the /user/demo HDFS directory. Finally, you run the imported note.
- Sign in to Oracle Big Data Manager. See Access Oracle Big Data Manager.
- On the Oracle Big Data Manager page, click the Notebook tab.
- Right-click the copy_data_from_http_to_hdfs.json file, select Save link as from the context menu, and then save it to your local machine.
- On the Notebook tab banner, click Home
 . In the Notebook section,
click Import note.
. In the Notebook section,
click Import note.
- In the Import As field enter Copy Data from http to HDFS.
By default, the name of the imported note is the same as the original note but you can override
it by providing a new name in this field. Click the Select JSON File icon.
In the Open dialog box, navigate to your local directory that contains the
copy_data_from_http_to_hdfs.jsonfile, and then select the file.
Description of the illustration import-new-note.png - Click the
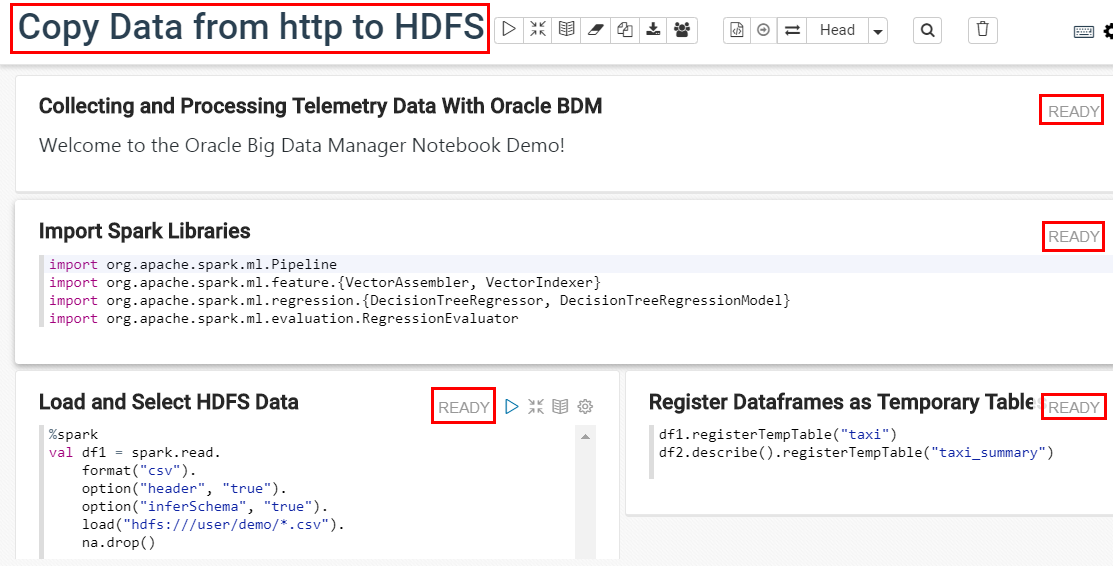
Copy Data from http to HDFSnote to view it. The initial status of each paragraph in the note isREADYwhich indicates that the paragraph has not been executed yet. - The first paragraph uses the
%mdMarkdown interpreter to generate static html from Markdown plain text. The second paragraph imports some Spark libraries. - The Load and Select HDFS Data paragraph uses the
%sparkSpark interpreter to create two dataframes. The first dataframe references all of the.csvfiles in the/user/demoHDFS directory (using the*wildcard character). This dataframe is stored in thedf1variable. The second dataframe selects some of the columns from the first dataframe. This dataframe is stored in thedf2variable.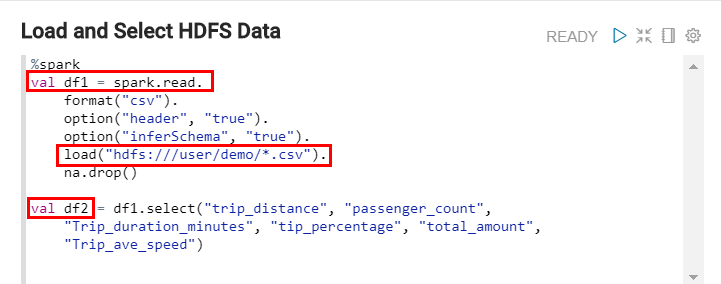
Description of the illustration create-dataframes.png You can reference the
df1anddf2variables anywhere in this Note. - The Register Dataframes as Temporary Tables paragraph registers the
df1anddf2dataframes as temporary tablestaxiandtaxi_summaryrespectively. You can run SQL queries on these temporary tables.
Description of the illustration register-dataframes.png - The View All Taxi Data paragraph uses the
%sqlinterpreter. This enables you to execute a Spark SQL query. The query in this paragraph displays the data in all rows and columns in thetaxitable in a tabular format.
Description of the illustration data-table.png - The Group Trips by Duration paragraph groups the individual trips by the trip duration, and then counts the number of trips in each group. The
taxidata is displayed in a Bar Chart format.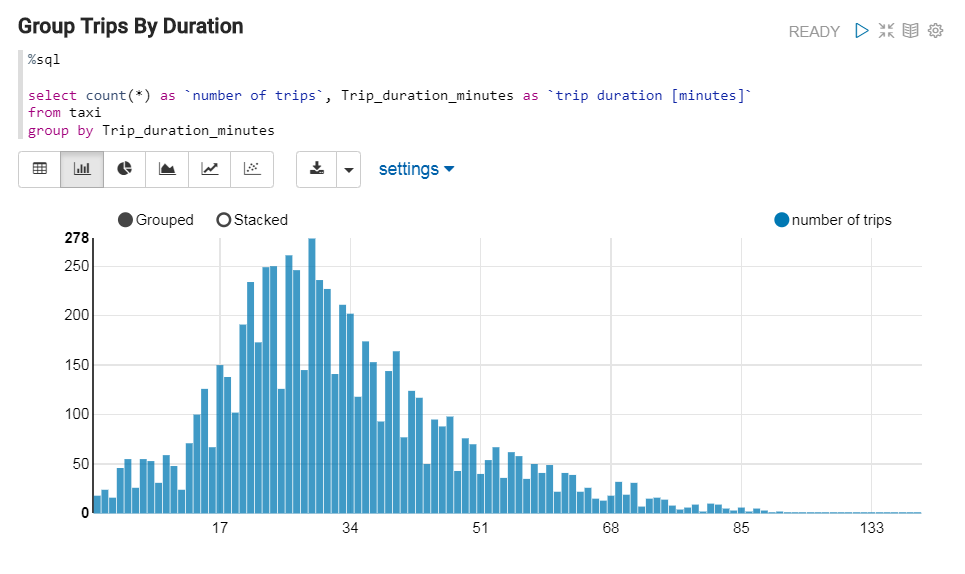
Description of the illustration data-chart.png - The View Dataset Summary paragraph uses the
%sqlinterpreter. This enables you to execute a Spark SQL query. The query displays all rows in thetaxi_summarytable in a tabular format.
Description of the illustration view-dataset-summary.png - Click Run all paragraphs
 on the Note's toolbar to run all
paragraphs in this note.
on the Note's toolbar to run all
paragraphs in this note.

Description of the illustration run-paragraphs.png A Run all paragraphs confirmation message is displayed. Click OK. When a paragraph executes successfully, its status changes from
READYtoFINSIHED.

The Import New Note dialog box is is displayed.
The Copy Data from http to HDFS note is imported and displayed in
the list of available notes in the Notebook.