Understanding the Similarity Discovery Prediction Results
The similarity discovery results predict the overall similarity of the two files and also the similarities at the column level.
The similarity discovery engine predicts similarity by finding the best match for a column in one profile to a column in the other profile. This pairing is done based on similarities of the column type and column data from the profile metadata. The columns might pair up in order, out-of-order, or not at all. Each pair’s similarity is predicted on a scale of 1 to 100.
The results of the similarity discovery web service are displayed in a JSON format. First the overall similarities are listed followed by the detailed pairing similarities. You can use only the overall similarity predictions for your analytical purposes or drill down all the way into the individual predicted overlapping column pairs.
-
leftId: name of the first datafile used in similarity discovery -
rightId: name of the second datafile used in similarity discovery -
similarity: the overall similarity prediction score ranging from 0 to 100. A higher score indicates more similarity between the two files. The overall similarity score is based on the following three similarities: column data, column order, and column types. These three similarities are individually listed next in the JSON output. -
similarityColumnData: the similarity prediction score for the data overlap between the predicted columns pairs in the two profiles -
similarityColumnOrder: the similarity prediction score for the predicted columns pairs order in the two profiles -
similarityColumnTypes: the similarity prediction score for the similarity of two profiles’ column type regardless of the column order -
weightSimilarityColumnData: a weighing number ranging from 0.0 to 1.0 used to calculate the overall similarity score -
weightSimilarityColumnOrder: a weighing number ranging from 0.0 to 1.0 used to calculate the overall similarity score -
columnRelationships: gives detailed information for the columns that are predicted to be similar. For each mapping pair, the column number of the similar columns is listed with a prediction score. Additionally, pairs are scored for their histogram match, header similarity, example value intersection, and character sequence intersection. -
leftOrphanIds: lists columns in the first datafile that are predicted to not map to any columns in the second datafile. -
rightOrphanIds: lists columns in the second datafile that are predicted to not map to any columns in the first datafile.
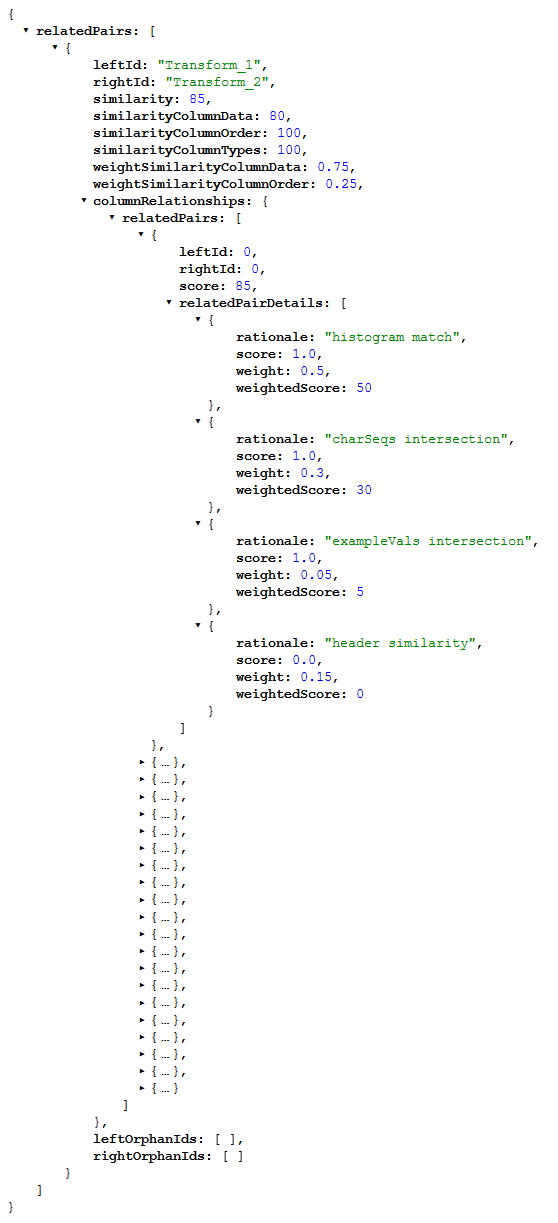
Below are the similarity discovery prediction results for two files that are very similar. The screenshot shows the overall similarity predictions and the detailed predictions for one mapping column. Note that the first column from file 1 maps to the first column in file 2.

Description of the illustration similarity_discovery_example1.png
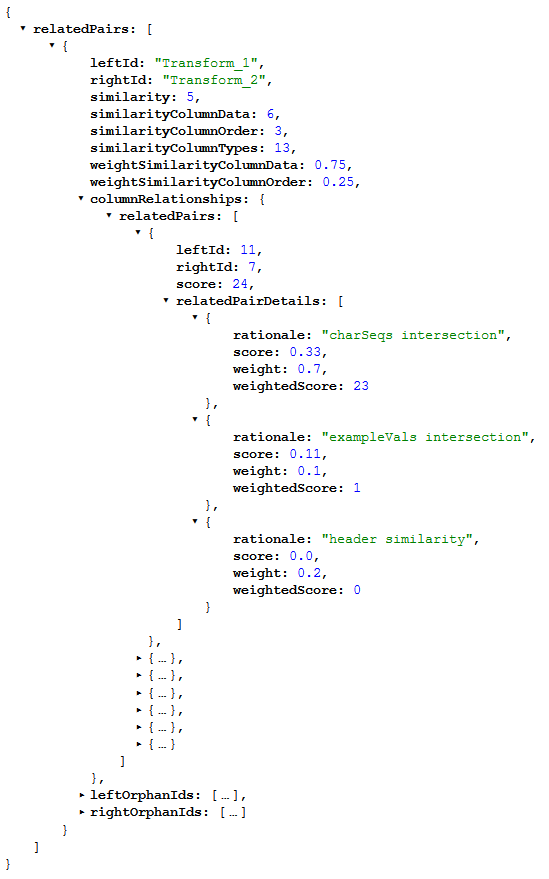
Below are the similarity discovery prediction results for two files that are not so similar. The screenshot shows the overall similarity predictions and the detailed predictions for one mapping column. Note that the predictions indicate that the 11th column from file 1 maps to the 7th column in file 2.

Description of the illustration similarity_discovery_example2.png