Oracle Data Safe Dashboard
When you sign in to Oracle Data Safe, you are presented with a dashboard, which consists of several charts that you let you monitor activities.
The dashboard has a Security controls section and a Feature metrics section.
The Security controls section provides a fleet-wide view of the security measures used across your target databases in the selected compartment. Oracle databases have several security measures built into the database and this section shows you how many of your target databases have certain security measures enabled. Analyzing this information provides you with insight into the potential security threats that your target databases are exposed to based on the security messures that are or are not enabled.
Click on the numbers next to each security measure to see a more detailed view of which target databases have the listed security measures enabled. Click on the name of any target database to view the latest security assessment for the selected database.
The following screenshot is an example of the Security controls section.

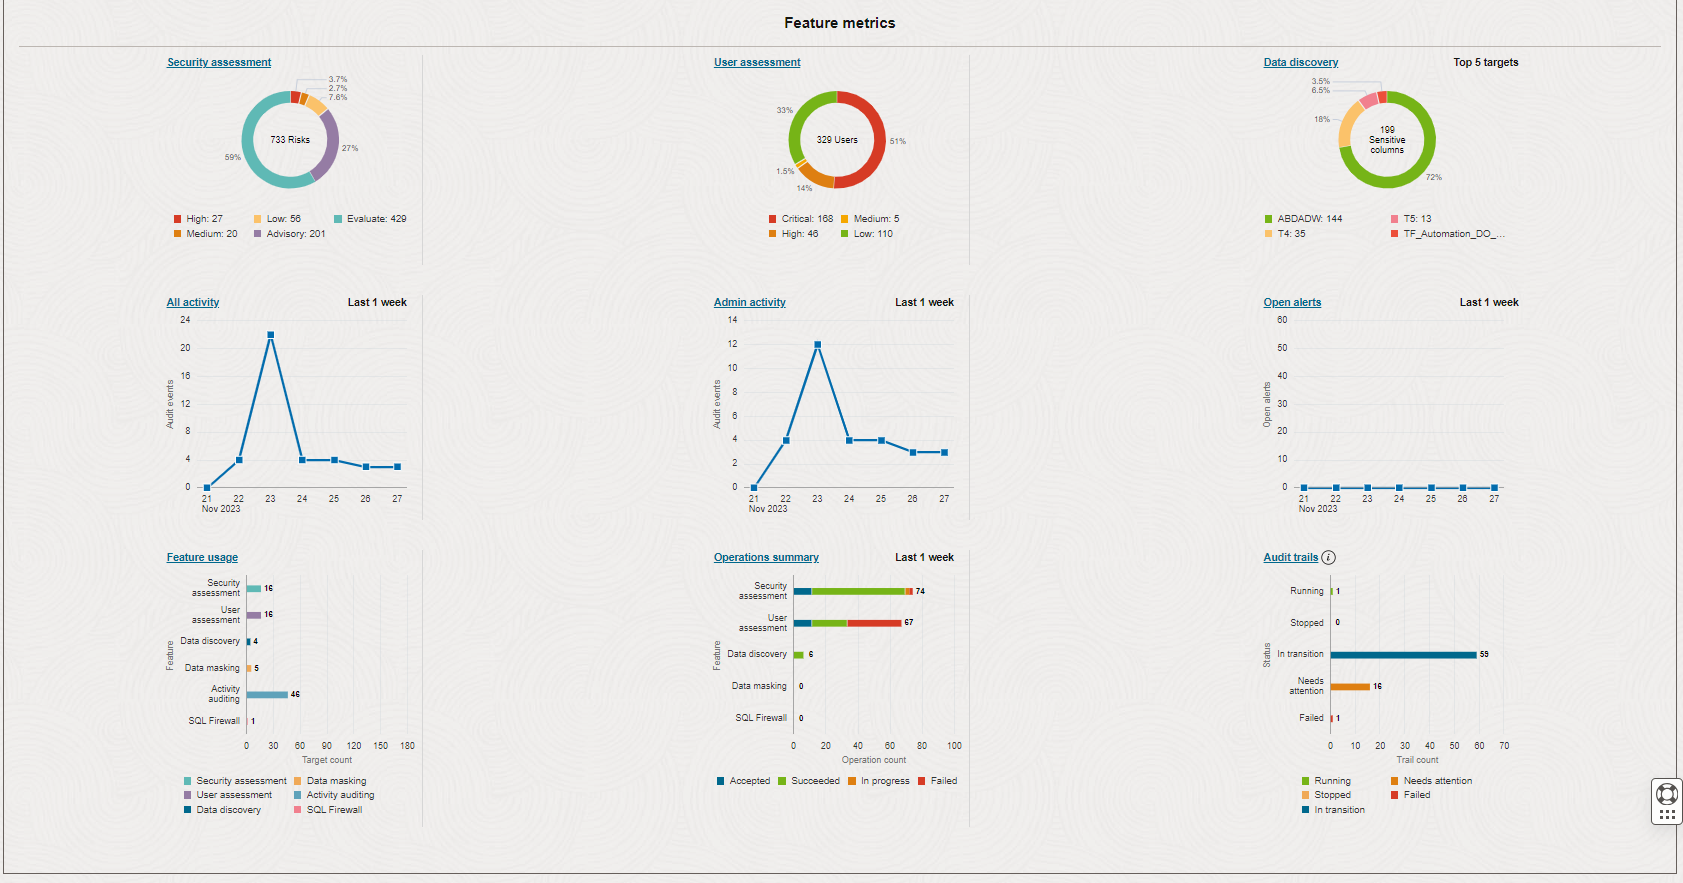
- Security Assessment: View the percentage of advisory, evaluate, low, medium, and high risk security configurations in your databases.
- User Assessment: View the percentage of low, medium, high, and critical potential risk users in your database.
- Data Discovery: View the top five sensitive columns in your top five target databases.
- All Activity: View the number of audit events per day for the past one week performed by all users.
- Admin Activity: View the number of audit events per day for the past one week performed by admin users.
- Open Alerts: View the number of open alerts per day for the past one week.
- Feature Usage: View the number of target databases using each Oracle Data Safe feature (Security Assessment, User Assessment, Data Discovery, Data Masking, and Activity Auditing).
- Operations Summary: View the number of failed, in progress, succeeded, and accepted operations for Security Assessment, User Assessment, Data Discovery, and Data Masking for the past one week.
- Audit Trails: View the number of audit trails that are running, stopped, in transition, needs attention, and failed.
If you are accessing Security Center for the first time, then the charts may have no data to display. After you register a target database, Oracle Data Safe automatically performs a User Assessment and Security Assessment for your target database, which populates the Security Assessment and User Assessment charts in the dashboard. You can filter the data in the dashboard by compartment and target database.
The following screenshot is an example of the Feature metrics section.
