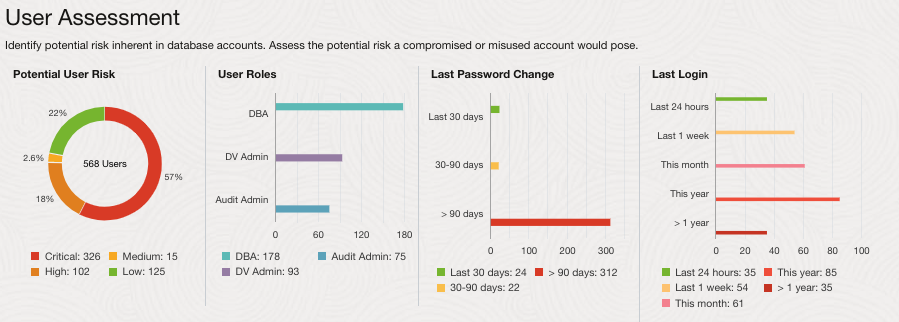
The Potential User Risk, User Roles, Last Password Change, Last Login, and Password Expiry Date Charts
The dashboard provides a set of charts that show you the current user security status at a glance. It also provides Risk Summary, Target Summary, and Notifications tables where you can drill down to get more details about current potential risk factors.
The charts show you the collective potential risk findings from the most recent assessment of each target database in the selected scope.
- The Potential user risk chart breaks down the total number of users found and shows the percentage at each potential risk level.
- User roles shows the crucial roles held by privileged users in you target databases.
- Last password change shows how recently users of the target databases changed passwords.
- Last login shows how recently users of the target databases changed passwords.
- The Password expiry date chart shows the number of users whose passwords will expire within three distinct time intervals (next 30 days, 30-90 days, and beyond 90 days). Clicking on a bar opens a side panel that lists target databases on the left, showing those databases with users whose passwords expire within that period, and their corresponding latest assessments on the right. From there, you can click an assessment name to open a pre-filtered user assessment report displaying only the affected users in that database.
These charts give you a quick overview about the state of user security for target databases in the compartment. In the example below, you can see that the latest assessment within this scope found a substantial number of users categorized as critical or high risk.
More detail is provided in the tables on the dashboard. In both of these tables, use the links to drill down to more detailed information.
