Troubleshoot using the Oracle Cloud console
Learn to troubleshoot OCI GoldenGate using metrics found in the Oracle Cloud console.
Note:
This information applies only to Data replication deployments.Related Topics
Deployment Information
You can use the following information in the Deployment Information tab to help you troubleshoot:
- OCPU Count: The base number of Oracle Compute Units (OCPUs) the OCI GoldenGate deployment has available to consume, without auto scaling. This is also the minimum meter for OCI GoldenGate.
- Auto Scaling: When enabled, the OCI GoldenGate deployment can scale up to three times the OCPU Count value.
- Public IP: If public endpoint was enabled when the OCI GoldenGate deployment was created, then the public IP is shown.
- Private IP: The private IP that can be accessed from your (the customer's) subnet.
- Console URL: The FQDN that can be used to access the OCI GoldenGate Deployment Console, over a public or private network. If private, then the console URL must be accessed from the private network.
- OCID: The deployment's Oracle Cloud Identifier (OCID) that is required for opening a service request (SR) with Oracle Support.
Metrics
Note:
Ensure that you upgrade your deployment to the latest version to leverage all available metrics.Metrics are collected every five minutes for each deployment. The data produced can help you troubleshoot issues that you may encounter.
- CPU Utilization: The aggregate of all OCPUs. For example, if you specify 3 as the OCPU Count and enable Auto Scaling when you create the deployment, then the total OCPUs that can be used is 9. When the utilization is above 33.333%, it means 33.333% of 9 OCPUs.
- CPU Consumption: The aggregate number of OCPUs consumed. For example, when OCPU Utilization is greater than 33.333% of 9 OCPUs, you are billed for the integer value over 33.333%, which is 4 OCPUs. When Auto Scaling is not enabled, you're billed for the base number of OCPUs.
- Memory Utilization: The percentage of aggregated memory. Each OCPU allocates 16 GB memory.
- Deployment Overall Health: Each deployment has a health score,
which is the aggregate health of the underlying OCI GoldenGate deployment
processes: Administration Service, Distribution Service, Receiver Service, and
Performance Metrics Service.
- Healthy: 100%
- Unhealthy: >100%
For example, if two of the four processes are healthy, then the health score is 50%.
Note:
When you add a subprocess, such as an Extract or Distribution Path, you can designate it as Critical to Deployment Health. If the subprocess is stopped, then the Administration Service is deemed unhealthy.
- Deployment Inbound Lag: Lag is caputured for Extracts that are designated as critical. This metric is aggregated across all critical Extracts.
- Deployment Outbound Lag: Lag is captured for Replicats that are designated as critical. This metric is aggregated across all critical Replicats.
- Swap Space Usage: Displays the amount of swap space, in gigabytes, the deployment is using.
- Temporary Space Usage: Displays the amount of temporary space, in gigabytes, the deployment is using.
- File System Usage: Displays the amount of file system space, in gigabytes, the deployment is using.
- Extract Status: Displays the overall health of the deploymen's Extract
processes:
- 100% when the processes are Running
- 0% when the processes are Abended or Stopped
- Replicat Status: Displays the overall health of the deployment's Replicat
processes:
- 100% when the processes are Running
- 0% when the processes are Abended or Stopped
- Distribution Path Status: Displays the overall health of the deployment's
Distribution Path processses:
- 100% when the processes are Running
- 0% when the processes are Abended or Stopped
- Receiver Path Status: Displays the overall health of the deployment's
Receiver Path processses:
- 100% when the processes are Running
- 0% when the processes are Abended or Stopped
- Extract Lag: Displays the average lag time, in seconds, of an Extract process in the deployment.
- Replicat Lag: Displays the average lag time, in seconds, of a Replicat process in the deployment.
- Distribution Path Lag: Displays the average lag time, in seconds, of a Distribution Path process in the deployment.
- Receiver Path Lag: Displays the average lag time, in seconds, of a Receiver Path process in the deployment.
For more information, see Metrics.
Example: Troubleshooting deployment health
This example shows you how to troubleshoot when deployment health is not 100%.
To troubleshoot deployment health in the OCI GoldenGate Deployment Console:
- Create alarms to
evaluate Deployment Health.
You'll receive notifications when Deployment Health is less than 100%.
- Launch the OCI GoldenGate Deployment Console from the Deployment Details page and sign in.
- In the OCI GoldenGate Deployment Console, click
Performance Metrics Service and
review the status of each process.
If a subprocess like Extract or Replicat is stopped, it directly affects the Administration Service health, giving a health score of 0 (unhealthy). Therefore the overall deployment health is 75% because only three of the four processes are healthy.
Log files are also available for each process. For more information about how to troubleshoot using the OCI GoldenGate Deployment Console log files, see Troubleshoot using the deployment console.
Example: Troubleshooting OCPU Utilization
This examples shows you how to troubleshoot when OCPU Utilization is greater than 90%.
Extracts and Replicats consume OCPU cycles as they replicate data. Parallel Replicats create many applier processes for each Replicat process. After reviewing the performance metrics in the OCI GoldenGate Deployment Console, additional OCPUs may need to be added to the OCI GoldenGate deployment, or enable Auto Scaling if it's not enabled.
To troubleshoot OCPU Utilization:
- Launch the OCI GoldenGate Deployment Console and sign in.
- Click Performance Metrics Service.
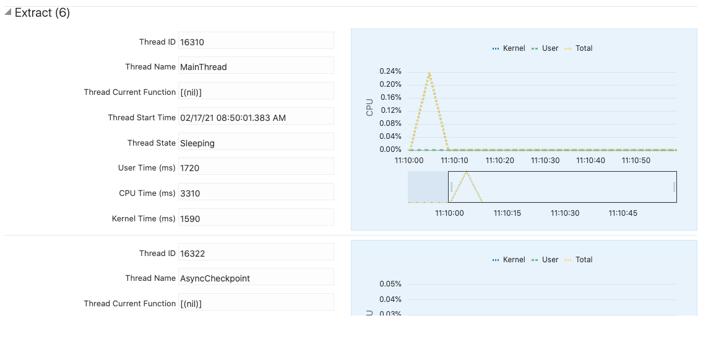
- Click each process to review its details, and then click Thread
Performance to see the status of each thread in that
process.

Description of the illustration threadperformance.pngThis information can be used to troubleshoot each process, including CPU consumption of each thread.
