About Monitoring
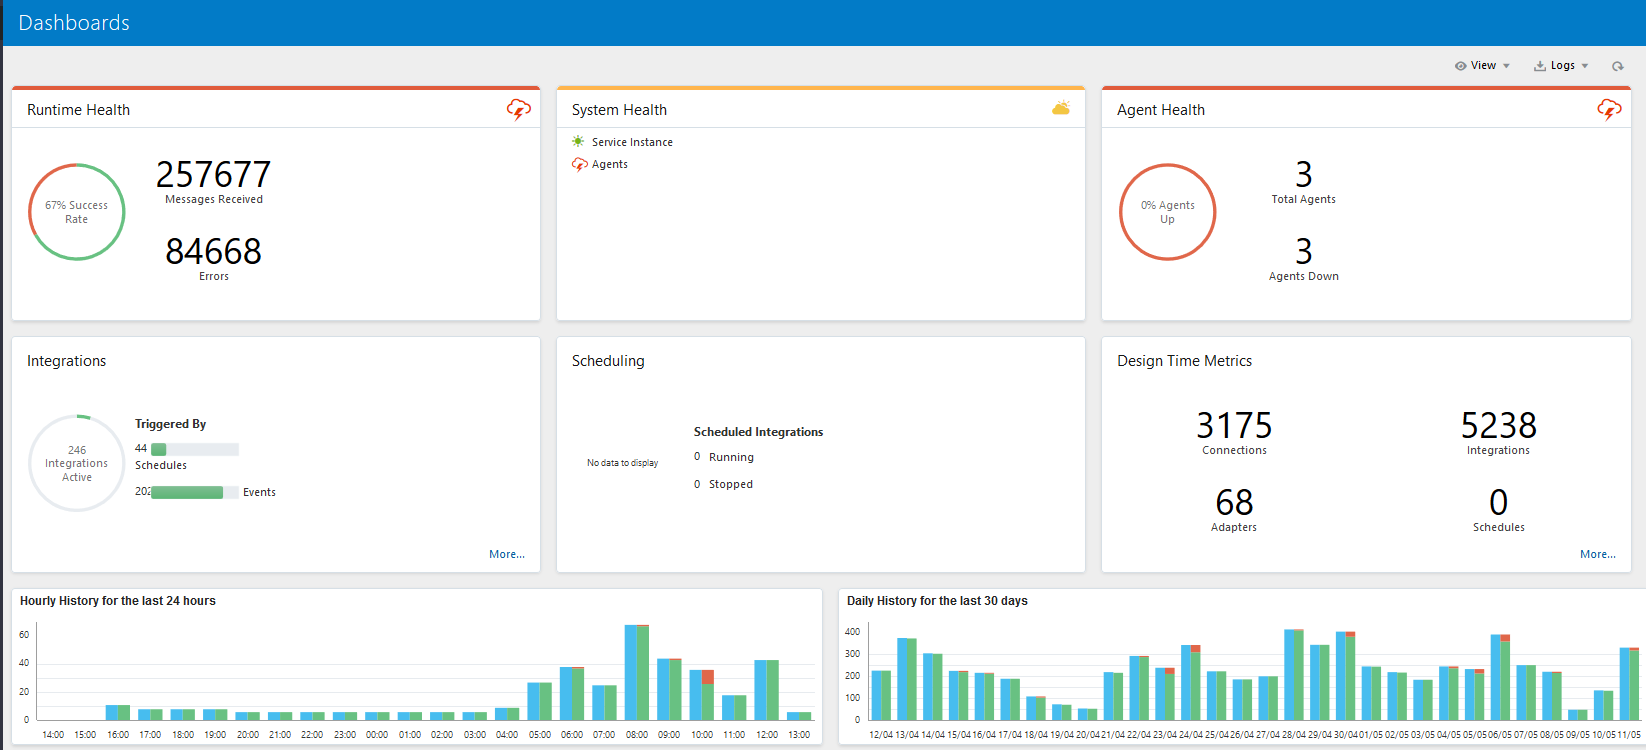
The Oracle Integration dashboard displays information about the current state of all your running integrations.
The dashboard gives you a quick view into the performance metrics for all of your
active integrations. The graph includes the total number of messages processed, the
average processing time, the number of messages with errors, and the success rate. The
Integrations tab lists metrics for each running integration, and you can view a graph of
the metrics for each integration in the list. The dashboard also provides a view of
recent activity for running integrations and the ability to download all
activities.
Description of the illustration dashboard_page.png