 Monitoring an IoT Application Powered with Analytics
 Before You Begin
This 15-minute tutorial shows you how to invoke the training and scoring batch analytics processors of your Internet of Things (IoT) application. You also monitor the results of the analytics processors.
Background
Your analytics powered IoT application can process, learn, and analyze big volumes of constantly changing data collected from sensors and devices.
The following image illustrates the components of an IoT Application that implements a streaming analytics processor and three batch analytics processors. It also shows the sequence of steps that the components perform with other Oracle Cloud Services and sensor devices to implement the use case.
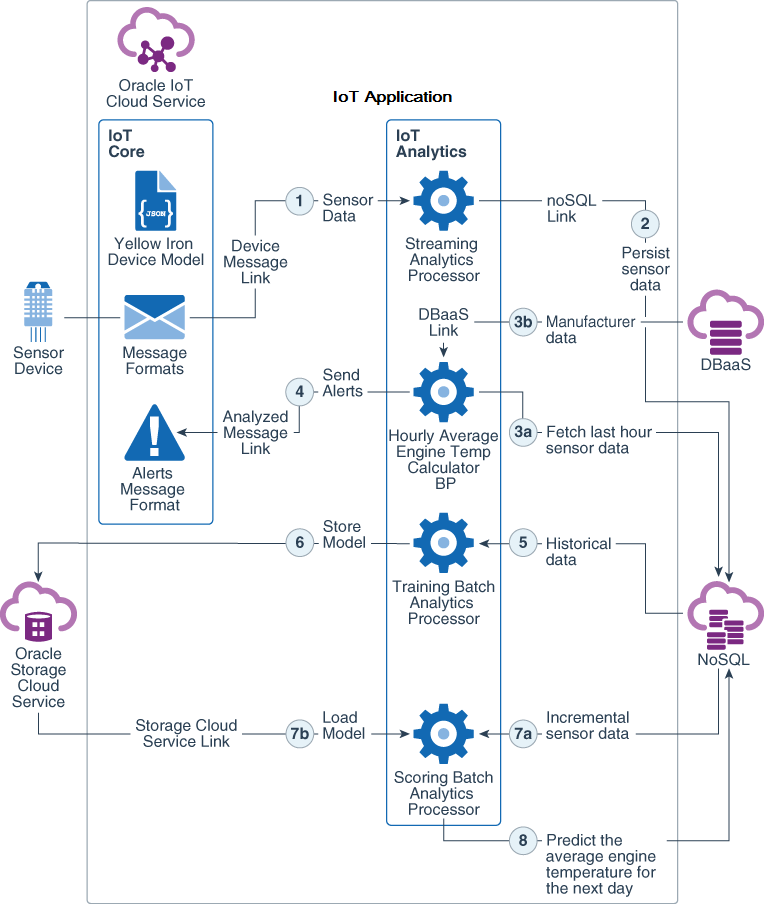
Your Vision Heavy Machines IoT application and the Yellow Iron simulator application should be running for a minimum of two days to generate and store sensor data in the Oracle NoSQL Database table. The batch analytics processors need this historical sensor data for training and then predicting the average engine temperature for the next day.
In the previous tutorial you inserted historiacl sensor data into the table.
In this tutorial, you invoke the training and scoring batch analytics processors through their REST endpoints, and then monitor their processing results.
What Do You Need?
- Access to an instance of Oracle Internet of Things Cloud Service with Analytics
- Any REST client plug-in added to your web browser such as RESTlet Client for Chrome
- A minimum of two days of sensor data in the
raw_sensor_datatable in Oracle NoSQL Database - The name of your Oracle Storage Cloud Service container and folder that will store the training model
- An epoch converter tool
 Invoke the Training Batch Analytics Processor
In this section, you use a REST client plugin to invoke the training batch analytics processor.
- Sign in to your instance of Oracle IoT Cloud Service.
- On the Oracle IoT Cloud Service home page, click Menu
 , click Applications, and then click Vision Heavy Machines.
 - On the Vision Heavy Machines menu, click Analytics, and then click Deployment Information.
- On the Service API Documentation tab, copy the URL value for the training-bap batch analytics processor.
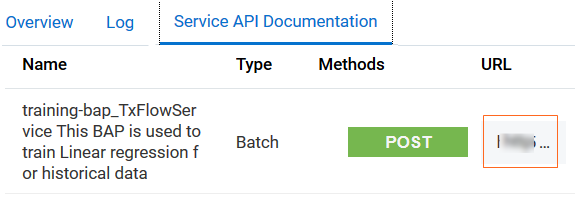
Description of the illustration rest_api.png - To invoke the batch analytics processor, on a new tab of your web browser, open the REST client plugin. In the REQUEST section, select or enter the following information. Notice that in the Body section, you provide the details of your Oracle Storage Cloud Service (OSCS) instance. which is the location where the training model will get stored.
- Method: POST
- URL: value of URL?
async=true - Headers: Content-Type:application/json
- Body:
{


                                "modelPath":"oscs file schema://name of the oscs container/name of the folder"
}
Note: the folder gets created if it does not exist in OSCS
- Authorization:
- Username:
username to access Oracle IoT Cloud Service - Password:
password
- Username:
- Click SEND. Verify that in the RESPONSE section, the HEADER tab displays a 202 ACCEPTED message.
- To view the status of the processing, in the RESPONSE section, on the HEADER tab, notice the REST endpoint appearing in the LOCATION field. To invoke it in the REST client tool, click the endpoint value.
- On the BODY tab, verify that the status field displays DONE. If it displays as RUNNING, then repeat the invocation of the LOCATION endpoint until the status displays DONE. This indicates that the training is complete and the training model is stored in OSCS.
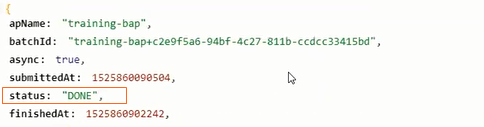
Description of the illustration status.png
 Invoke the Scoring Batch Analytics Processor
- On the Oracle IoT Cloud Service home page, click Menu , click Applications, and then click Vision Heavy Machines.
- On the Vision Heavy Machines menu, click Analytics, and then click Deployment Information.
- On the Service API Documentation tab, notice that your scoring-bp batch analytics processor is listed. Copy the value of URL for the processor.
- Identify a date range in which the sensor data will be analyzed. Use an epoch converter tool to convert your start date and end date to milliseconds. Note the epoch timestamp values of the start date and end date.

Description of the illustration epoch.png - To invoke the batch analytics processor, on a new tab of your web browser, open the REST client plugin. In the REQUEST section, select or enter the following information:
- Method: POST
- URL: value of URL
- Headers: Content-Type: application/json
- Body:
{}
epoch timestamp of start date: epoch timestamp of end date
Note:
1522908378086:1522965999416is an example of the timestamp range from the bulk data that you inserted. - Authorization:
- Username:
username to access Oracle IoT Cloud Service - Password:
password
- Username:
- Click SEND, and verify that in the RESPONSE section, a 202 ACCEPTED message is displayed.
- To view the status of the processing, in the RESPONSE section, on the HEADER tab, notice the REST endpoint in the LOCATION field. To invoke it, click the endpoint.
- In the Response section, on the BODY tab, verify that the status field displays DONE. If it displays as RUNNING then continue to invoke the endpoint till the status displays DONE. This indicates that the scoring is complete and the prediction value is stored in Oracle NoSQL Database.
 Monitor the Prediction Results
In this section, you invoke a Data Link CRUD endpoint on the prediction noSQL link to identify the predicted value of the hourly average engine temperature.
- On the Vision Heavy Machines menu, click Analytics, and then click Deployment Information.
- On the Service API Documentation tab, scroll to the Data Link CRUD endpoints section.
- Copy the URL value for the
prediction-output-nosqllink.
Description of the illustration prediction_data_link.png - To invoke the endpoint, on a new tab of your web browser, open the REST client plugin. In the REQUEST section, select or enter the following information.
- Method: GET
- URL: value of URL
- Headers: Content-Type:application/json
- Authorization:
- Username:
username to access Oracle IoT Cloud Service - Password:
password
- Username:
- Click SEND. Verify that in the RESPONSE section, you notice a 200 OK message.
- On the BODY tab, verify that the record from the prediction table is displayed. Notice the predicted value of the average hourly engine temperature for the next day.
You have successfully implemented, deployed, executed, and verified an IoT application powered with analytics.
 Query the Training Metadata Information
In this section, you create a worksheet and run a query on TRAINING_MODEL_INFO table in Oracle DBaaS in which the training batch processor stored the metadata about the training model. Worksheets are used to explore data through queries while you design and develop your IoT application.
- On the Vision Heavy Machines menu, click Analytics, and then click Worksheets.
- On the Vision Heavy Machines page, click Create Worksheet.
- On the Create Worksheet page, enter the following, and click Create:
- Name:
prediction-worksheet - Description:
Worksheet to view the prediction data
- Name:
- On the prediction-data-worksheet page, click Create Query.
- On the Create Query page, in the Name field enter
training-query, and click Create. - Expand the training-query component, and enter the following query, and ensure that you enclose the DBaaS link name within grave accents (``):
select * from `trained-model-info` - To deploy your worksheet, click Deploy, and then on the Start Worksheet Server page, click Start.
- Ensure that on the Output for Deploy window a BUILD SUCCESS message is displayed. To close the Output for Deploy window, click Collapse
 .
. - To run the query, click Run
 next to training-query. The result is displayed in a tabular format by default.
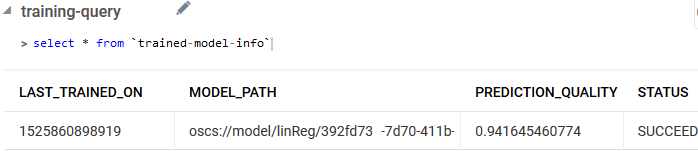
Description of the illustration model_info.png - From the query results, review the value of PredictionQuality that indicates the accuracy of the prediction analysis.
 Query and Visualize the Prediction Data
In this section, you write a query in a worksheet and run it to view the predicted results that the scoring processor stored in Oracle NoSQL Database.
- On the Vision Heavy Machines menu, click Analytics, and then click Worksheets.
- On the Vision Heavy Machines page, click prediction-worksheet.
- On the prediction-worksheet page, click Create Query
 .
. - On the Create Query page, in the Name field enter
prediction-query, and click Create. - Expand the prediction-query component, enter the following query, and ensure that you enclose the NoSQL link name within grave accents (``):
select * from `prediction-output-nosql` - To deploy your worksheet, click Redeploy, and then on the Start Worksheet Server page, click Start.
- To run the query, click Run next to prediction-query. The result is displayed in a tabular format by default.
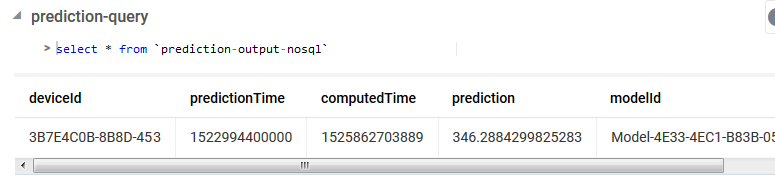
Description of the illustration prediction.png - From the display drop-down list, select Bar Chart. Click the bar chart to view the predicted temperature.
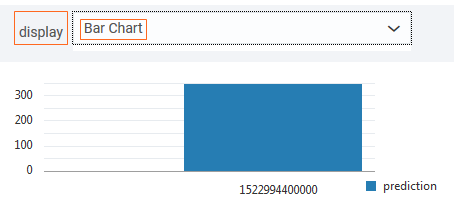
Description of the illustration prediction.png