2 Isolate and Diagnose Application Performance Issues
Using Oracle Application Performance Monitoring, you can monitor performance of your application by following transactions across servers to identify the exact tier causing an application issue, see if the issue is specific to a geography and see application logs automatically in context of the application performance. Synthetic Monitoring helps in simulating a path in the application that a user would normally take, and ensure that the user can transition through the different web pages in the path smoothly. This helps is recognizing application performance issues before the end user experiences it.
Typical Workflow for Isolating Application Performance Issues
This section uses an example scenario to illustrate how you can isolate application performance issues. In this example scenario, as a DevOps administrator, you’re responsible for administering and supporting one of your enterprise applications used by your customers interested in carpool and vanpool services. Your line of business executives see a sudden drop in sales on your company website, and they ask you to investigate the reasons for drop in sales on the website. The ordering application is critical to your business, and it’s used by your customers daily to place service orders on your website.
Enterprise application deployments are complex. They involve various software tiers comprising applications, databases, web servers, and so on. You need simple and effective ways to isolate application issues and troubleshoot problems quickly.
You start troubleshooting this specific problem by:
-
Viewing alerts to see if the average response time for any page has exceeded the threshold
-
Checking if the errors are specific to any geography and drilling down to isolate the exact problem location
-
Isolating the problem down to the application servers and databases
-
Drilling down to logs to determine the exact root cause of the problem causing drop in sales on your website
Here are the common tasks to isolate application performance issues.
| Task | Description | More Information |
|---|---|---|
|
View alerts |
From the list of alerts, pick an alert and view details. | |
| Troubleshoot a slow page | View details about the page to identify a possible problem in the page. | |
| Identify a slow request | Identify which request is slowing down the performance of the application. | |
| Identify issues in associated tiers | Inspect associated tiers and identify issues. | Find Issues in Associated Tiers |
| Identify issues based on location | Identify if issues are being seen in a specific country | Using Geomaps to Find Issues in Pages |
| View related logs | Drill down to related logs to identify issues. | Drill Down to Related Logs |
| View Diagrams to spot issues | Study Diagrams to easily spot issues | Isolate Issues through Diagrams |
View Alerts
Oracle Application Performance Monitoring notifies you of application performance issues. As a DevOps administrator, you start troubleshooting by viewing such alerts, which provide a starting point to isolate the problem.
View alerts from the Alerts page
-
In the Oracle Application Performance Monitoring home page, in the left navigation pane, click Alerts.
OR
In the Alerts tile on the Home Page, click the number of Alerts. You can also click the number of Critical Alerts, or Warnings to view only the specific alerts.
The Alerts page displays all the alerts that need your attention.
-
Select APM in the Service dropdown to view Alerts from Oracle Application Performance Monitoring. You can further filter based on severity. You can view the following details of an alert.
Detail Description Message The last alert message seen on this object. Click the message to view details and history of the alert. Entity and Entity Type The object for which the alert exists. Click the entity to open the object. Entity type is the type of object, a Page, or an AJAX call. Duration Duration for which this alert has been open. -
The icon in the first column indicates the type of alert — the status of an alert could be Critical, Warning, Clear (closed), and Fatal being the most severe. Click the arrow next to the icon to view some more details of the alert like Created Date, the Updated Date, and a brief history. In case of a closed alert, the Closed Date is displayed.
-
Click the alert Message to view the details of the alert more closely.
-
Click the Entity to view details of the entity on which the alert was created.
View alerts from the entity page
If an alert is created on an entity based on alert rules, the alert will be displayed in the entity page for that time period. You can view the alerts in the Alerts pane on the entity page.
-
The Alert pane displays the number of new alerts, open alerts that were carried over from previous time periods, and alerts that are still open at the end of the selected time period.
-
The Alerts tab lists all the alerts during the selected time period and their current status. Click the arrow next to the status of the alert to view details.
-
If the alert is an early warning, a chart indicates when the trigger event occurred. A prediction of how soon an error might occur is indicated.
Troubleshoot a Slow Page
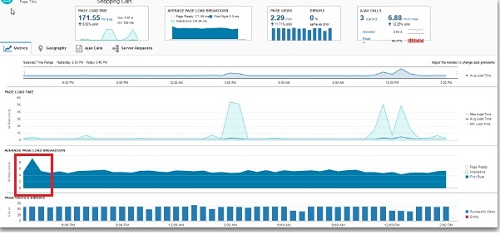
Oracle Application Performance Monitoring helps identify a page that is loading slowly and points to possible reasons for the decrease in speed.
To identify the reason for a slow page:
Drill Down to Server Request Details
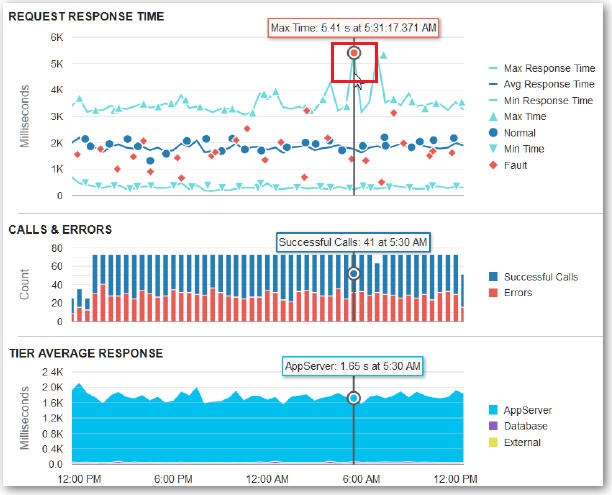
Oracle Application Performance Monitoring automatically discovers, classifies, and measures all your server requests. You get the information you need to understand what tier, request, and operation the application issue resides in. Let’s start monitoring server requests to investigate which requests have issues.
Find Issues in Associated Tiers
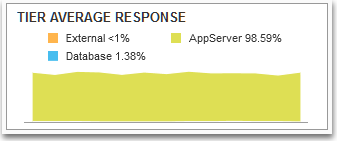
Oracle Application Performance Monitoring helps you recognize bottlenecks in tiers associated with server requests.
Find Issues in Pages Using Geomaps
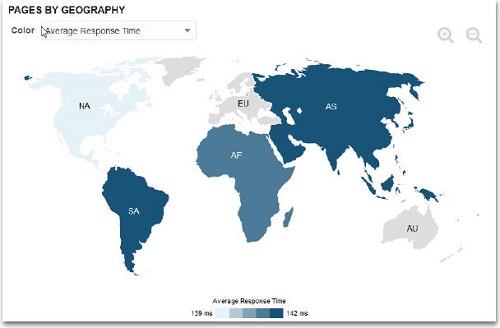
Oracle Application Performance Monitoring helps you isolate issues in pages based on geography.
You can drill-down and view regions within the following countries in the geomap:
- 'BEL': Belguim
- 'CHN': China
- 'FRA': France
- 'DEU': Germany
- 'GBR': Great Brittain / United Kingdom
- 'IND': India
- 'ITA' : Italy
- 'JPN': Japan
- 'ESP': Spain
- 'THA': Thailand
- 'NLD': The Netherlands / Holland
- 'USA' : United States of America
Drill Down to Related Logs
To isolate the application performance problem further, you can view and inspect log events of a request instance or an application server that might be causing the problem.
-
Application Server details page to see logs for that one application server.
-
Server request details page to see logs for the application server and databases relevant to the server request.
-
Server request Database tab to see logs for the databases relevant to the server request.
-
Server request Instances to see logs for the application server and database(s) specific to that server request instance.
- Drill down to logs related to a server request:
- In the Server Request Details page, go to the Instances tab and select an instance.
- In the Server Request Instance page, click View Related Logs above the summary pane.
- Drill down to logs related to an application server:
- Select the application server and view details.
- Click View Log above the Application Server summary pane.
Here’s an example of how to drill down to related logs to isolate an issue.
-
Let us start from the
cart.jsppage, for which an alert was displayed, primarily because the response time for the page was very high.
-
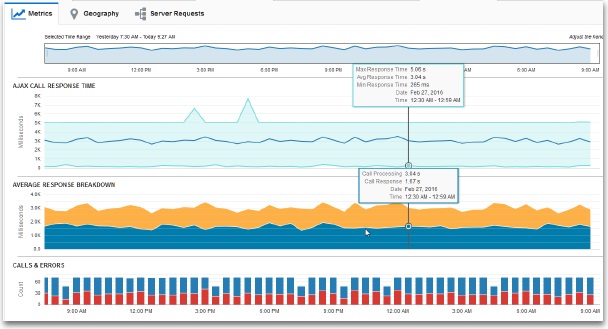
Drill down to view details of the checkout Ajax call.

Notice that the Ajax call has encountered a high number of errors.
-
The call processing and the response times indicate a very slow call along the timeline. The call has encountered some errors.
-
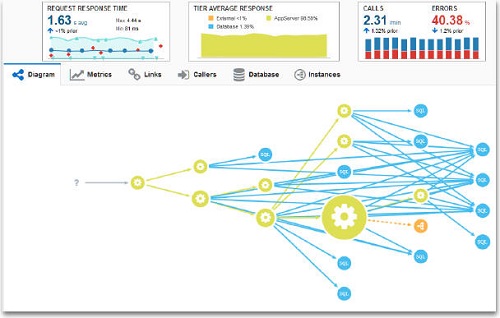
The corresponding server request checkout indicates errors. Let us drill down further to view details of the server request checkout. The errors seem to be very high, close to 40%.

-
The Diagram tab displays all calls made by the server request. Hover over an object or an arrow to view details of the object or the call.
-
Let us drill down to Instances to see what operation is failing. In the Instances tab, pick an instance which has a fault. Click View Related Logs to inspect this further by viewing logs.
-
The log points to the time when the fault occurred, and indicates issues at the application server and the database levels.

Isolate Issues through Diagrams
The Diagram tab in the Server Request details page gives a quick diagrammatic view of all the objects associates with the server request.
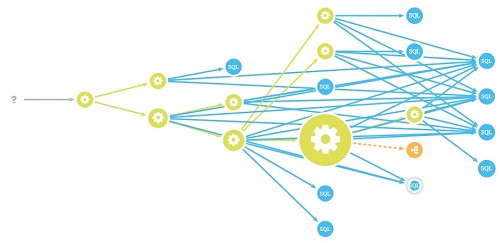
Here is the diagram of a server request with all the connected objects like the SQL calls, server requests and AJAX calls. The question mark indicates an unknown caller.
Using the Diagram
The diagram represents the server request in the center, with all the calls made to and from the server request represented by a node. Hover over any connector between two nodes to cut out other traffic, and view details about the specific call. Hover over any node to view only the connections to and from the selected node. This helps in isolating the specific call you are looking for, to enable quicker identification of issues. Here is example of how hovering over a connector and a node cuts out other information from the diagram.

Using the Calls table
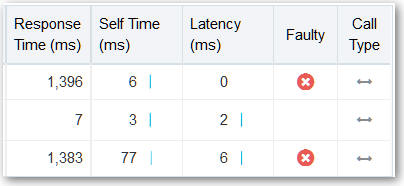
The Calls table that appears below the diagram lists all the calls made to and from the server request, showing only information pertaining to the object currently selected in the diagram. You can drill down further from this table to view the details of the server request, or of a related AJAX call to isolate a problem.
Using the Context menu
You can right-click on any node in the diagram to see a context menu through which you can easily move forward with troubleshooting and isolating the cause for an issue. The options available in the context menu depends on the type of object the selected node represents.
For example, right click a SQL call and select Isolate this Operation’s Calls. This will remove all other nodes from your diagram. From among the existing nodes, click on a server request node to display the operation’s inward and outward paths.
Typical Workflow for Using Synthetic Monitoring
You can use Synthetic Monitoring to script or record user paths, and use this to simulate user transactions on the application. These paths can be continuously monitored through Application Performance Monitoring, and potential issues can be caught early, before the end user experiences it.
Note:
You can define and use Synthetic Monitoring only if you have installed the Cloud Agent on Linux.Here’s a typical workflow for setting up and using Synthetic Monitoring:
| Task | Description | More Information |
|---|---|---|
| Deploy Cloud Agents | This is a requirement before you can define locations.
This is applicable only for private locations. |
See Install Cloud Agents in Installing and Managing Oracle Management Cloud Agents. To ensure that you can define and use Synthetic Monitoring, the Cloud Agent should be installed on Linux. |
| Check for pre-requisites | Review the list of pre-requisites.
This is applicable only for private locations. |
|
| Define Locations | Define locations. This is done by an APM Administrator.
This is applicable only for private locations. |
|
| Define Synthetic Tests | You can define synthetic tests for a HTTP Ping, Page Load or a Scripted Action. | Define Synthetic Tests |
| Review Synthetic Test reports | Use the Synthetic Test reports to monitor the performance of your applications. | Monitor Application Performance through Synthetic Tests |
| View Sessions | For synthetic tests of type Scripted Actions, you can view details of the session when the test was run. This option is available only if you are running synthetic tests on an application that is also being monitored by Oracle Application Performance Monitoring. |
|
| View HAR Reports | View HAR reports for HTTP Ping or Scripted Action. This is available for public locations. |
|
Define Synthetic Tests
You can schedule synthetic tests for various locations and ensure that the performance of the application is monitored at all times.
Monitor Application Performance through Synthetic Tests
You can monitor the performance of your application through synthetic tests and identify possible issues before they occur.
Oracle Application Performance Monitoring enables you to define and run synthetic workflows on your application. You can define a test for a HTTP ping, test for a specific page, or record a Selenium based script of a workflow on your application, and run these monitoring tests on your application anytime without having to wait for the actual workflow to occur.
You can view the results of the scheduled test and monitor the performance of the application, view the usage of resources and isolate possible issues.
To view the reports of scheduled synthetic test:
-
In the left navigation pane, select Synthetic Tests. All the scheduled synthetic tests are listed in the Synthetic Tests pane.
From this pane, you can view high level data about the listed synthetic tests, like the type of test, application, location, frequency, execution time, and availability. Scan through these details to identify the synthetic test you would like to drill down into.
-
You can sort the listed synthetic tests on a number of criteria. Sort the tests based on Status to view the tests with errors on top. A green check mark over the test icon indicates a successful test, and a red X indicates errors while running the test.
-
Examine the metrics and select the synthetic test report to drill down into. Click the synthetic test. The Synthetic Test page displays details of the synthetic test.
-
The Metrics tab displays information on availability, execution time, time breakdown, transfer rate and download size. The details in this tab are for all the tests executed across all locations, and depends on the type of synthetic test.
-
HTTP Ping: This report displays information like availability, execution time, transfer rate, download size and ping time breakdown.
-
Page Load: This report displays information like availability, execution time and total load time breakdown.
-
Scripted Action: This report displays information for multiple pages that are part of the script and includes data points like AJAX calls and total load time breakdown.
-
-
The Instances tab displays details for individual tests that were run across all locations.
You can view the status of the test run at a specific time, for a specific location. If there is an error in the test, the error message is displayed in this pane.
-
For synthetic tests of type Scripted Actions, you can view details of the session when the test was run. In the Instances tab, click View Session. This option is available only if you are running synthetic tests on an application that is also being monitored by Oracle Application Performance Monitoring. The Session page displays a timeline view of the session along with details of multiple pages accessed during a user session. You can further drill down into the details of the individual pages within the timeline. See Monitoring End User Experience through Sessions.
-
For synthetic tests created on public locations, and for of the type Scripted Action and Page Load, you can view HAR reports. In the Instances tab, click View Har.
The Har Statistics page displays details of the HTTP pages. You can view a summary of the data as graphs and detailed tables.
Note:
On Firefox, if you are trying to view HAR files, the browser might display an error ‘Unresponsive Script’. Click Continue and wait for the script to complete. This usually happens when the HAR files are large (above 600 KB). -
To download the content, click Download Har or Download Screenshot. When downloading the content as a screenshot, it will be downloaded to the local host as a zip file.
-
Create Alert Rules Based on Synthetic Tests
Create Alert Rules when selected Synthetic Tests meet defined conditions and send a notification when the alert is raised, worsens in severity, or is cleared.
- From the left-hand navigation, click APM, then select Alert Rules.
- Click Create Alert Rule. Enter a name and click Add Entities.
- In the Select Entities menu, select Individually and click a Synthetic Test.
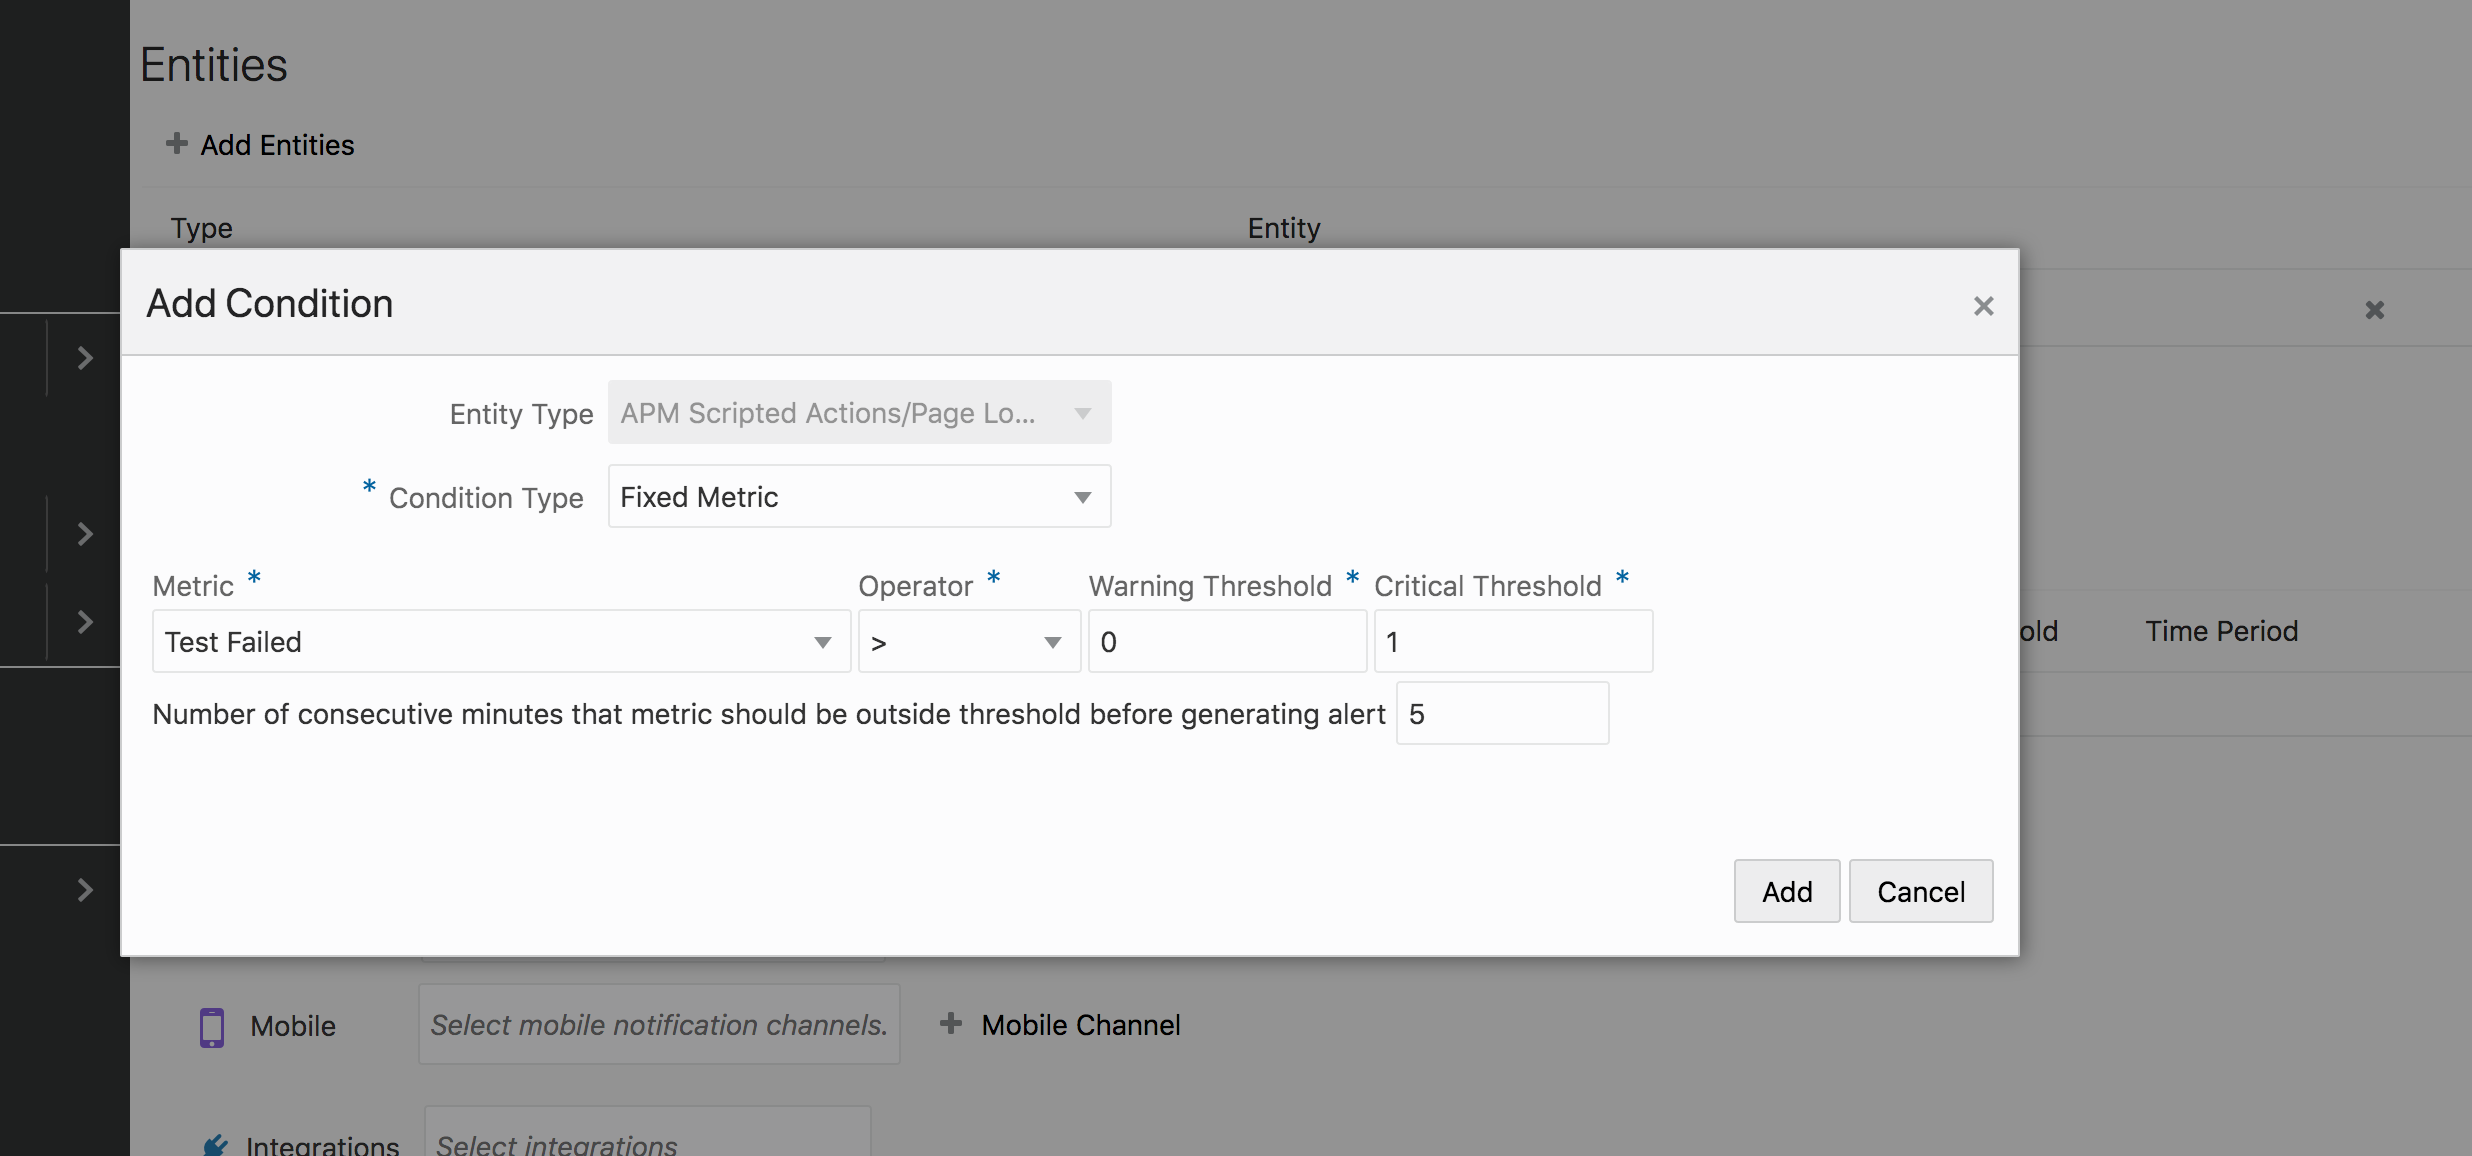
- Click Add Condition and select a Test Failed metric
with a warning or critical threshold greater than 0. Click Add.
The "number of consecutive minutes that metric should be outside threshold before generating alert" dialog should be less than the Collection Frequency selected for the Synthetic Test.
Figure 2-1 Test Failed Synthetic Alert Rule
- Create a new condition with the same parameters for the Test Error metric.
- Add the required notification channels.
- Click Save.
Metric and Frequency Examples:
-
Number of consecutive minutes >= Test frequency: This will generate an alert on the first test failure.
-
Number of consecutive minutes >= 2*Test frequency: This will generate an alert on two consecutive failures.
-
Test Failed > 0: This will evaluate a warning alert when there is a test failure.
-
Test Failed >= 1: will evaluate true when there is a test failure.
-
Test Failed > 1: will Not evaluate true when there is a test failure as on Failure metric value will be "1"
Test Failed > 0.5: will evaluate true when there is a test failure.
To learn more about Alert Rules, see Create Alert Rules.
Troubleshoot Synthetic Tests
If you run into problems while using Synthetic Tests, here are some tips to debug.
Debug Cloud Agent Location
You can run Synthetic Tests on a private or a public location. For a test to run successfully on a cloud agent, a few basic set of prerequisites, called Location Compatibility have to be in place. To check for Location Compatibility:
-
On the Oracle Management Cloud home page, click APM. In the left navigation pane, select APM Admin, and then, Locations.
-
For the required location, click Compatibility Check.
A green tick mark indicates that all the prerequisites are met; else a warning or error is displayed.
-
Click on the status indication icon to view these details.
-
Agent Version — Indicates the version of the cloud agent. Ensure that the Cloud Agent version is 1.33 or higher.
-
Firefox Version — Indicates the version of the browser. Ensure that you have the correct Firefox version for your system to successfully execute the Selenium tests.
- Oracle Linux 6: Firefox version 45
- Oracle Linux 7: Firefox version 61-66
Note:
Firefox is the only supported browser. Other Firefox versions including Beta versions are unsupported.You can check if Firefox is present on the cloud agent machine by running the command
firefox
                                        --version
. -
Proxy Status — Indicates the status of the proxy. Ensure that the proxy specified is correct and reachable. Edit the location to correct the proxy information, if required.
-
Proxy Error Message — Displays an error message in case of an error in the proxy settings.
-
X-Server Unavailable Ports — Indicates the X-Server ports that are not available. Create X-Server on the ports that are missing.
-
X-Server Unavailable Ports Message — Displays an error message if there are unavailable X-Server ports.
-
Debug Cloud Agent Crash Due to Memory Issues
When running Synthetic Tests that generate big HAR files, the Cloud Agent may run into memory issues and crash. When the Cloud Agent crashes, a log file is generated with name: hs_err_pid<pid>.log. It should look like the following:
Stack: [0x00007f771c697000,0x00007f771c798000],  sp=0x00007f771c795220,  free space=1016k
    Native frames: (J=compiled Java code, j=interpreted, Vv=VM code, C=native code)
      C  [libzip.so+0x11d10]  newEntry.isra.4+0x60 C  [libzip.so+0x12b57]  ZIP_GetNextEntry+0x37
      J 3024  java.util.zip.ZipFile.getNextEntry(JI)J (0 bytes) @ 0x00007f776995def6 [0x00007f776995de40+0xb6]
      J 1477 C1 java.util.zip.ZipFile$ZipEntryIterator.next()Ljava/util/zip/ZipEntry; (212 bytes) @ 0x00007f77694d6b4c [0x00007f77694d68a0+0x2ac]
      J 1475 C1 java.util.zip.ZipFile$ZipEntryIterator.nextElement()Ljava/lang/Object; (5 bytes) @ 0x00007f77694d5f84 [0x00007f77694d5ec0+0xc4]
    j  oracle.sysman.emd.fetchlets.gfmsynmon.common.CommonUtil.addToZipfile(Ljava/io/File;Ljava/lang/String;Ljava/lang/String;Ljava/lang/String;)Ljava/io/File;+106
    j  oracle.sysman.emd.fetchlets.gfmsynmon.selenium.HarFetchletUtils.prepareCombinedZip(Ljava/io/File;)Ljava/io/File;+349
    j  oracle.sysman.emd.fetchlets.gfmsynmon.selenium.HarFetchlet.getMetric(Ljava/util/Properties;Ljava/util/ArrayList;Loracle/sysman/emSDK/agent/datacollection/CollectionFactory;Loracle/sysman/emSDK/agent/fetchlet/FetchletContext;Loracle/sysman/emSDK/agent/TargetID;Ljava/util/Map;Loracle/sysman/emSDK/agent/fetchlet/StateFullCallbacks;)Loracle/sysman/emSDK/agent/datacollection/CollectionResult;+428
    j  oracle.sysman.gcagent.target.interaction.execution.FetchletFactory.getMetric(Ljava/util/Prop
To solve this issue, follow these steps:
- Navigate to your Cloud Agent installation folder, and edit emd.properties with a text editor.
- Search for the agentJavaDefines property and add the following flags:
agentJavaDefines=-Xmx2G -XX:MaxPermSize=128M -Dsun.zip.disableMemoryMapping=trueNote:
The -Xmx2G flag assigns 2GB as the maximum memory allocation pool for a Java Virtual Machine (JVM). The -Dsun.zip.disableMemoryMapping=true flag is needed for Cloud Agents versions 1.49 and below.
Debug Test Execution
You can check for the status of synthetic tests, and debug if they are not getting executed properly by following these steps.
-
Create a synthetic test with a private or a public location. Wait for a few minutes before checking for its deployment. A test on a private location takes about 5 minutes to deploy, and about 15 minutes to deploy on a public location.
-
On the Oracle Management Cloud home page, click APM. In the left navigation pane, select APM Admin, and then, Synthetic Test Definitions.
-
For the required location, click Check Deployment. The status of the test is displayed in the Test Status dialog box.
-
Location Name — Indicates the name of the private or public location.
-
Deployment Status — Indicates whether the test got deployed on the Agent or the Cloud Container.
-
Last Run Status — Indicates the time the test was last run. If the test was not executed, check for its location compatibility.
-
Last Deployment Time — Indicates the last time the test was deployed onto the Agent or the Cloud Container.
This time is first recorded when the test is created, and updated for each edit of the test. If the Deployment Status is Failed, and the test Run Status is Successful, then it means that the last update of the test failed.
-
Debug Log Location
You can check the logs to diagnose the failed test execution by following these steps:
- Change directory to the agent_inst folder:
$ cd $AGENT_HOME/agent_inst - Check test name in emd/targets.xml and note
test_meid:
<Property NAME="test_meid" VALUE="06E1665FE0A82B8057506B2A45F8FFC6"/> - Check logs in test_meid/log folder:
$ cd
                                $AGENT_HOME/sysman/ApplicationsState/beacon/06E1665FE0A82B8057506B2A45F8FFC6>/log/*
