4 Use Out-of-the-Box E-Business Dashboards
You can access the out-of-the-box dashboards for Oracle E-Business Suite from Oracle Management Cloud.
You can create a duplicate of the out-of-the-box dashboard and add more widgets to it or edit it to create your custom dashboard. See Work with Dashboards in Working with Oracle Management Cloud.
EBS Fleet
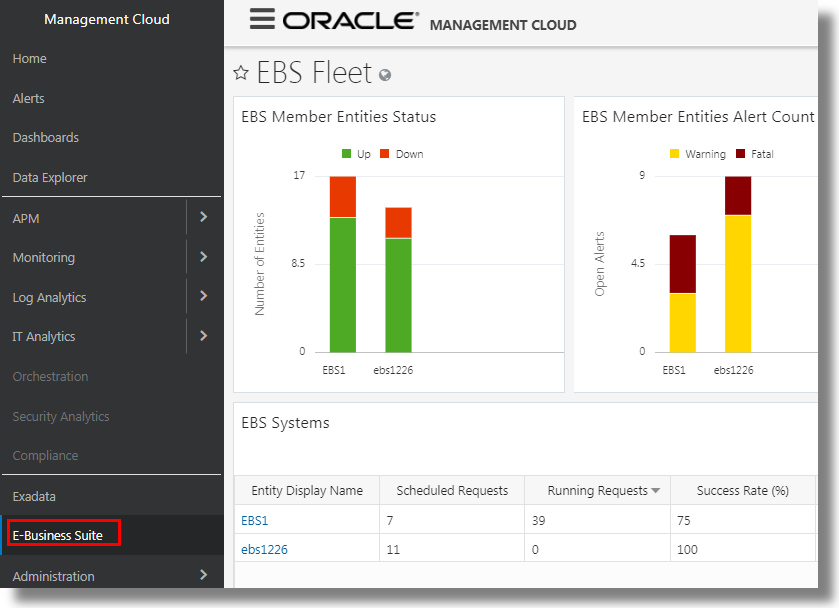
You can view all your Oracle E-Business Suite composite entities, their status, and their alert count by accessing the EBS Fleet dashboard.
-
Sign in to the Oracle Management Cloud home page by providing the user name, password, and the tenant name.
-
In the left navigation menu of the Oracle Management Cloud home page, click E-Business Suite.
Here’s an example EBS Fleet dashboard:
In the dashboard, you can view all your Oracle E-Business Suite systems listed in the table along with other details of each composite entity like scheduled requests, running requests, success rate, error rate, warning rate, and the forms sessions. You can also view the status of the member entities and their alert count.
-
In the EBS Fleet page, under EBS Systems, click the name of your Oracle E-Business Suite composite entity. The EBS Monitoring Dashboards open.
Access the Entity Dashboards
-
Sign in to the Oracle Management Cloud home page by providing the user name, password, and the tenant name.
-
In the Oracle Management Cloud home page, click Dashboards. In the Dashboards home page, click EBS Monitoring Dashboards. In the entity selector, select the Oracle E-Business Suite composite entity whose health you want to monitor. By selecting the composite entity, you can analyze the health of all those entities that are part of the composite.
Alternatively, from the Oracle Management Cloud Console navigation pane, click E-Business Suite. In the EBS Fleet page, under EBS Systems, click the name of your Oracle E-Business Suite composite entity. The EBS Monitoring Dashboards open.
-
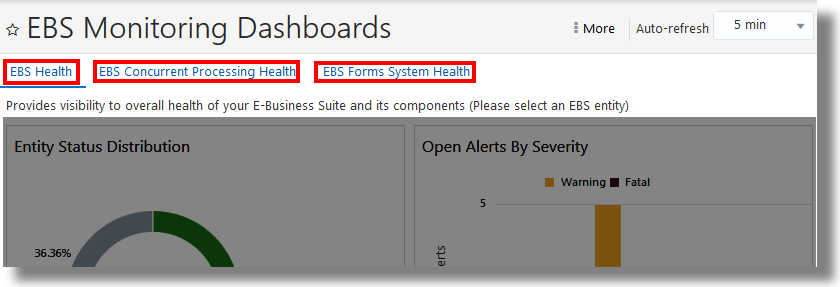
In this dashboard set, you can find the EBS Health, EBS Forms System Health, and EBS Concurrent Processing Health dashboards. Click on the dashboard to view the performance information of the corresponding entity.
The following is an example of the EBS Monitoring Dashboards set:
-
The data available in the dashboard depends on the time range you’ve selected in the time picker at the top right corner of the interface. Select a suitable time range to refine the data displayed.
EBS Health
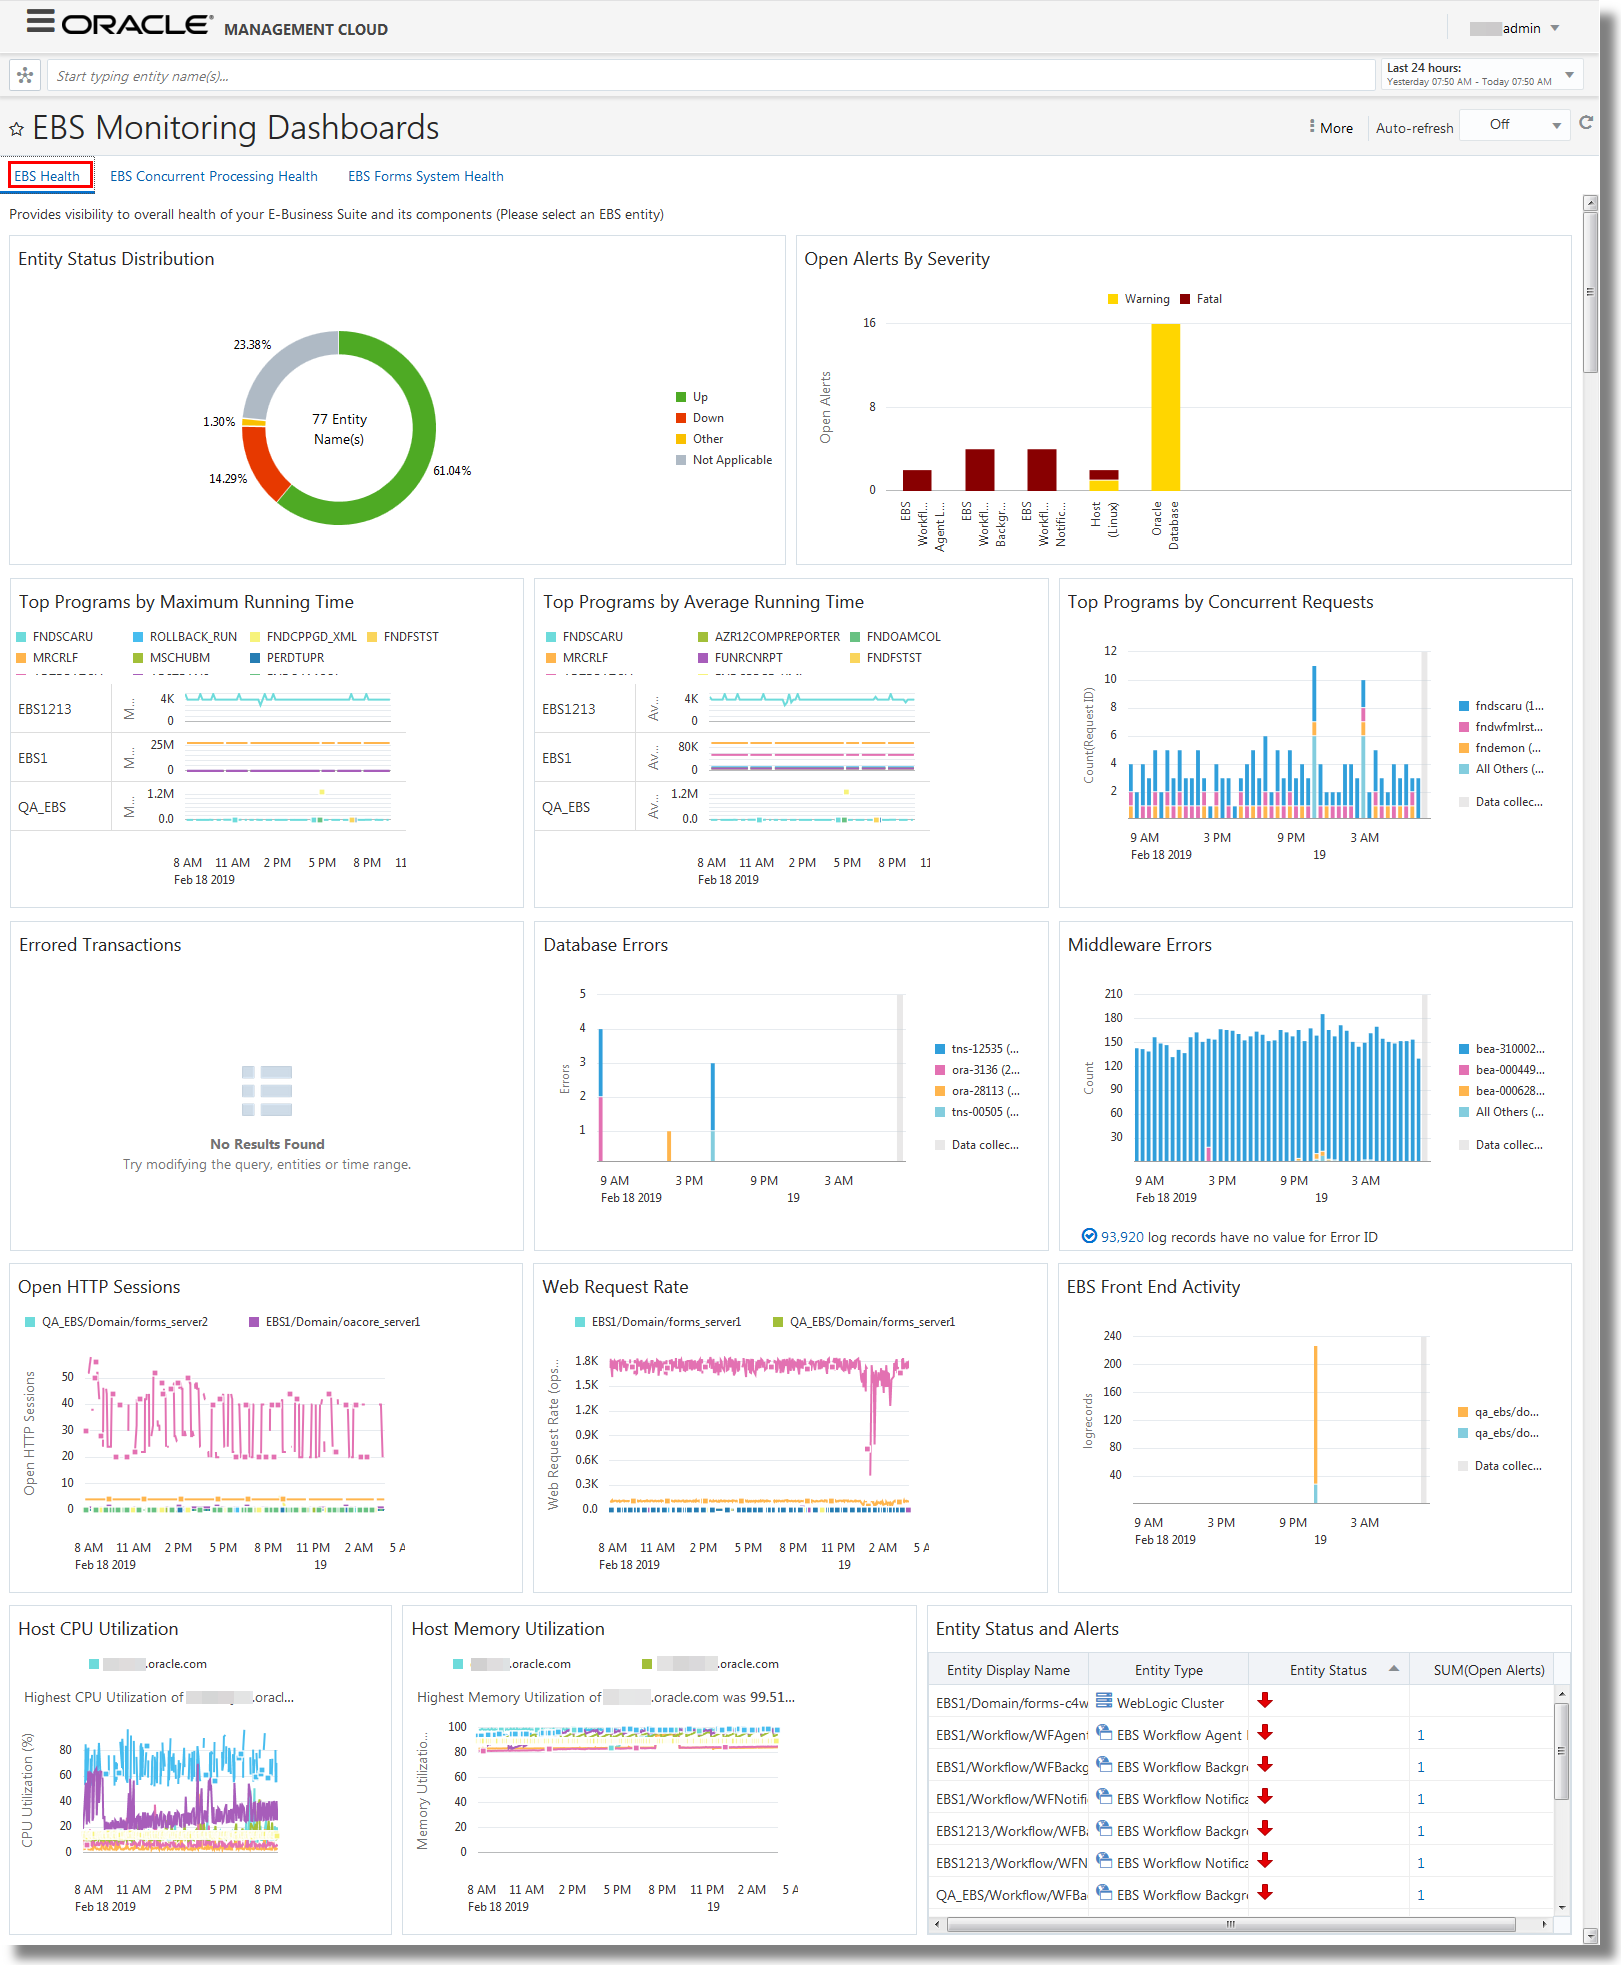
You can view the overall health of your Oracle E-Business Suite and its components by using the EBS Health dashboard.
Here’s an example EBS health dashboard:
The following widgets are available on the EBS Health dashboard:
-
Entity Status Distribution: Provides a donut distribution of the status of all the entities in your Oracle E-Business Suite.
-
Open Alerts By Severity: Provides a graph of open alerts that are generated for each entity in your Oracle E-Business Suite, and separates the alerts based on their severity with the use of different colors.
-
Top Programs by Maximum Running Time: Shows a visual distribution of the top programs that are grouped by the maximum time to execute.
-
Top Programs by Average Running Time: Shows a visual distribution of the top programs that are grouped by the average running time.
-
Top Programs by Concurrent Requests: Provides a time based distribution of the top programs that are based on number of requests identified by request ID. This widget collects and displays the log data from EBS Concurrent Request Logs log source.
-
Errored Transactions: Shows a graph of transactions with the number of errors plotted against time. This widget collects and displays the log data from Oracle EBS Transaction Logs log source.
Expand the widget from the dashboard to get the Log Explorer View. In this view, you can see the fields, User ID and ECID. You can additonally see the parameter Session ID if you've enabled it in the EBS Transaction Logging configuration.
- If the value of User ID is 0, then it suggests that you have only performed transactions which errored out when you used the SYSADMIN account. You can see other values of User ID you use other accounts.
- ECID is available for Oracle E-Business Suite revisions later than12.2.
-
Database Errors: Provides a visualization of the number of errors that are plotted against time, by identifying the database errors with the Error ID. The errors are distinguished with the use of different colors. This widget collects and displays the log data from all the log sources associated with the database entity types like Oracle Database Instance, Automatic Storage Management, Oracle Database Listener, and Oracle Clusterware.
-
Middleware Errors: Provides a visualization of the number of errors that are plotted against time, by identifying the middleware errors with the Error ID. The errors are distinguished with the use of different colors. This widget collects and displays the log data from all the log sources associated with the middleware entity types like Oracle WebLogic Server, Oracle Internet Directory, Oracle HTTP Server, Oracle Access Management Server, and Oracle WebLogic Domain.
-
Host CPU Utilization: Indicates the percentage of CPU utilization of each host in your Oracle E-Business Suite.
-
Host Memory Utilization: Indicates the percentage of memory utilization of each host in your Oracle E-Business Suite.
-
Entity Status and Alerts: Lists the entities in your Oracle E-Business Suite, and provides entity type, status, and alert information of each entity in the tabular format.
From this widget, you can navigate to EBS Forms System Dashboard or EBS Concurrent Processing Dashboard by hovering the cursor over the Entity Display Name > clicking the View More icon > clicking the down arrow next to Open in list > clicking Dashboard.
-
Open HTTP Sessions: Provides a line chart visualization of the count of open HTTP sessions plotted against time for each server.
-
Web Request Rate: Provides a line chart visualization of the number of web requests plotted against time for each server.
-
EBS Front End Activity: Indicates the count of log records collected from the access logs of the each server at a specific point in time.
Note:
-
Click on the parameters on the right side of the visualizations to view the details of each parameter.
-
Some of the widgets have an additional capability of rolling up the entity and time data to view the results in a larger landscape.
EBS Concurrent Processing Health
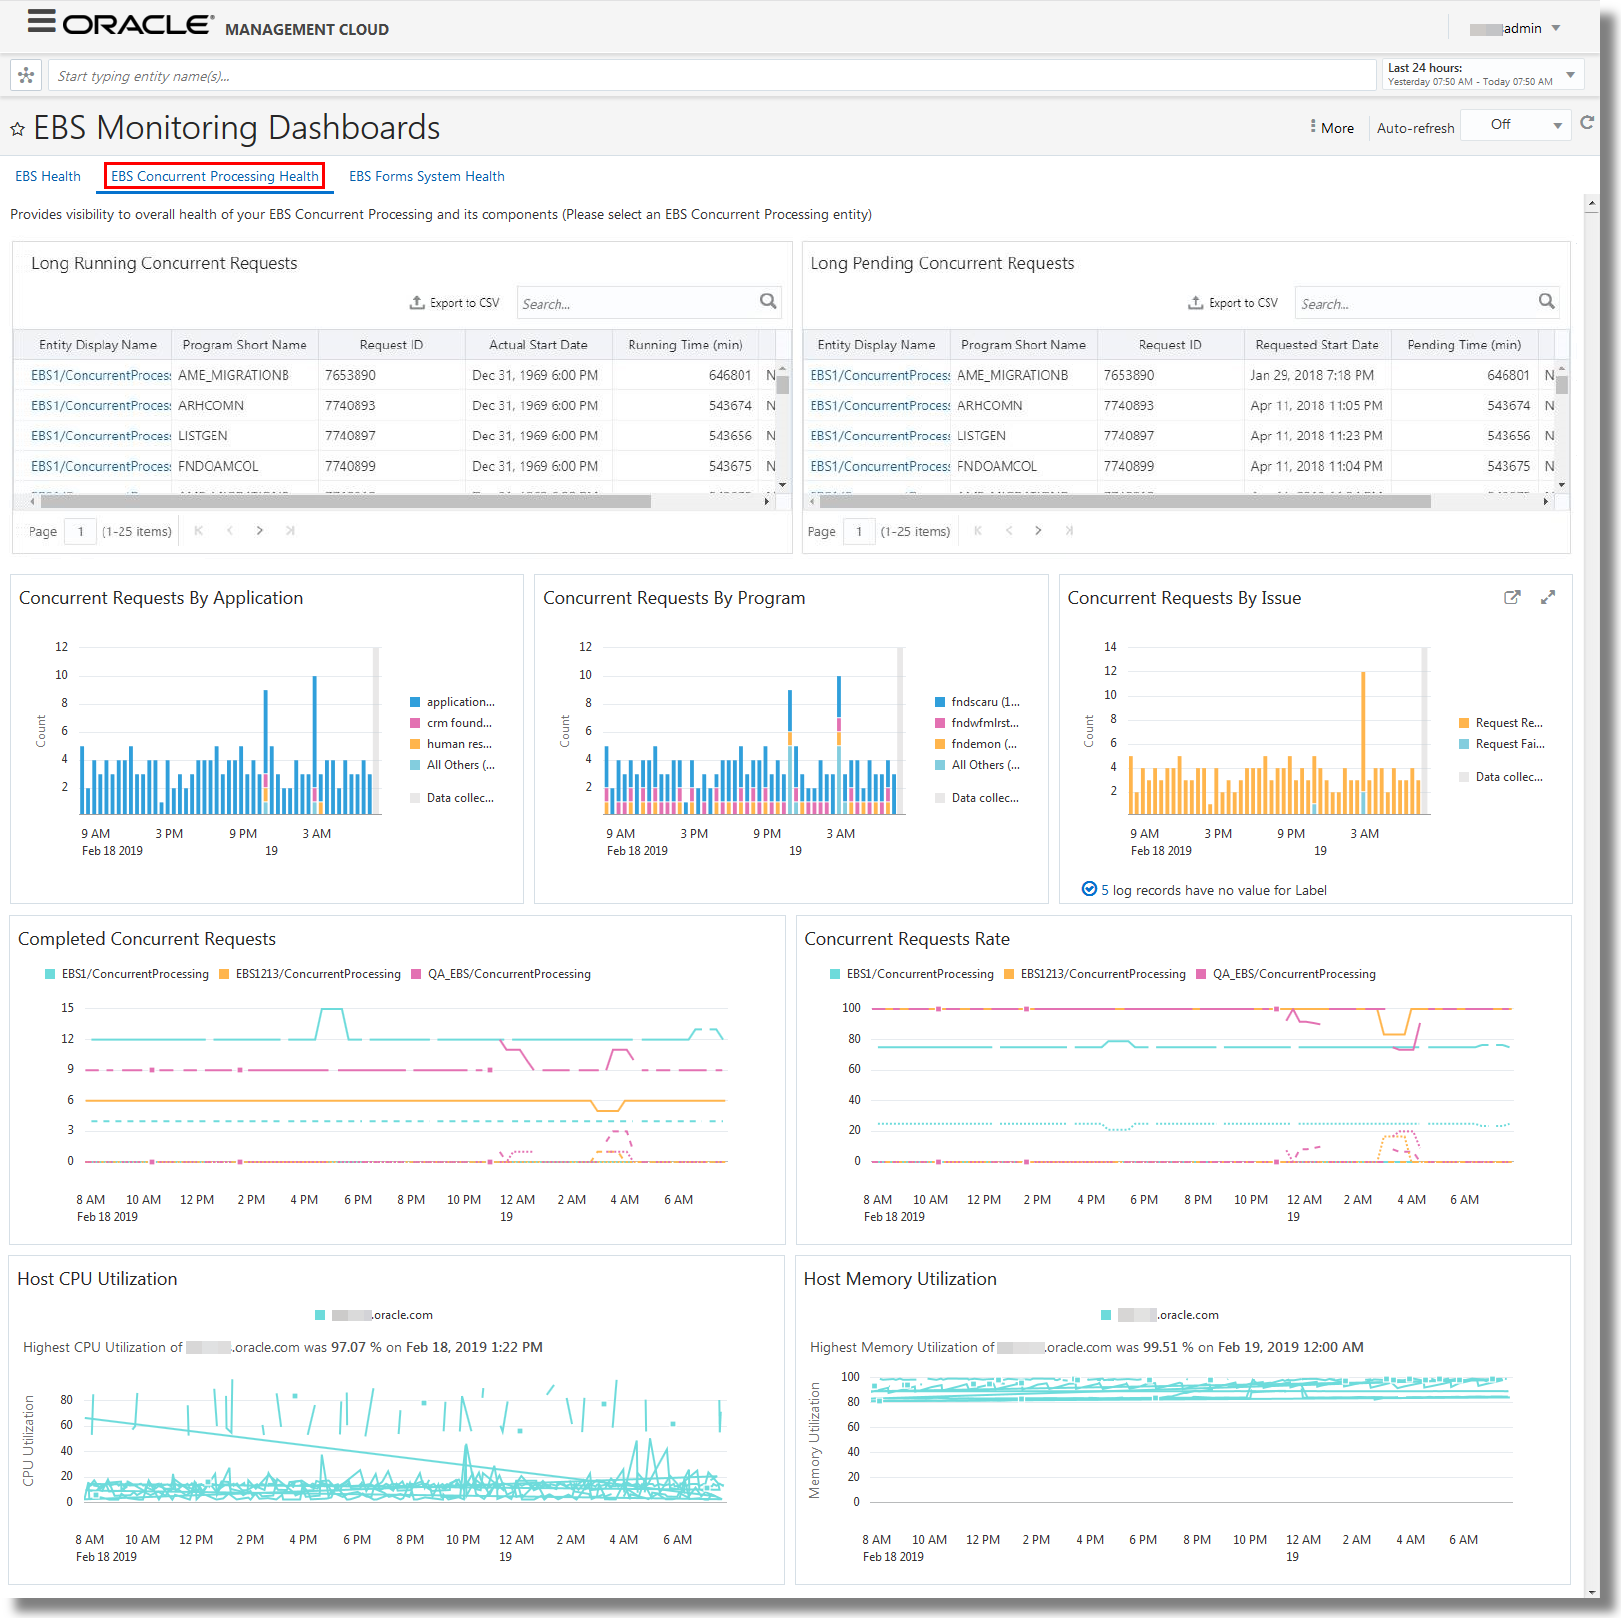
You can view the overall health of your concurrent processing entities and their components by using the EBS Concurrent Processing Health dashboard. Select the concurrent processing composite entity to view the details from the concurrent processing hosts in your Oracle E-Business Suite.
Here’s an example EBS Concurrent Processing Health dashboard:
The following widgets are available on the EBS Concurrent Processing Health dashboard:
-
Latest Long Active Concurrent Requests: Lists those requests that are not serviced for a long period of time. The table also provide all the other requisite details of the request.
You can select the elapsed time threshold and the maximum elapsed time for this metrics. Navigate to Oracle Management Cloud home page > Administration > Entity Configuration > Configure Entities > Select EBS Concurrent Processing entity > In the Conguration Properties dialog box, select Metrics. Update the values of the fields Max Elapsed Time (days) - Long Active Requests and Elapsed Time Threshold - Long Active Requests (minutes). You can also select to view the metrics earliest-first or latest-first by specifying asc or desc respectively in the field Earliest (asc) / Latest (desc) - Long Active Requests.
-
Concurrent Requests By Application: Provides a visualization of the number of application requests processed by the entity, which are plotted over time. The applications are distinguished in the chart with the use of different colors. This widget collects and displays the log data from EBS Concurrent Request Logs log source.
-
Concurrent Requests By Program: Provides a visualization of the number of program requests processed by the entity, which are plotted over time. The programs are distinguished in the chart with the use of different colors. This widget collects and displays the log data from EBS Concurrent Request Logs log source.
-
Concurrent Requests By Issue: Provides a visualization of the number of requests generated due to issues, which are plotted over time. The types of issues are distinguished in the chart with the use of different colors. This widget collects and displays the log data from EBS Concurrent Request Logs log source.
-
Completed Concurrent Requests: Shows a graph of the number of completed concurrent requests completed per hour. The requests are distinguished by their status at completion with the use of different line styles.
-
Concurrent Requests Rate: Shows the percentage of concurrent requests and the state of the requests.
-
Host CPU Utilization: Indicates the percentage of CPU utilization of each host in your concurrent processing entity.
-
Host Memory Utilization: Indicates the percentage of memory utilization of each host in your concurrent processing entity.
Note:
-
Click on the parameters on the right side of the visualizations to view the details of each parameter.
-
Some of the widgets have an additional capability of rolling up the entity and time data to view the results in a larger landscape.
EBS Forms System Health
You can view the overall health of your Forms System composite entity and its components by using the EBS Forms System Health dashboard.
The data for the analysis in this dashboard is obtained from the Oracle WebLogic Server Cluster for Oracle E-Business Suite Release 12.2. Select the Forms system composite entity to view the data from right hosts.
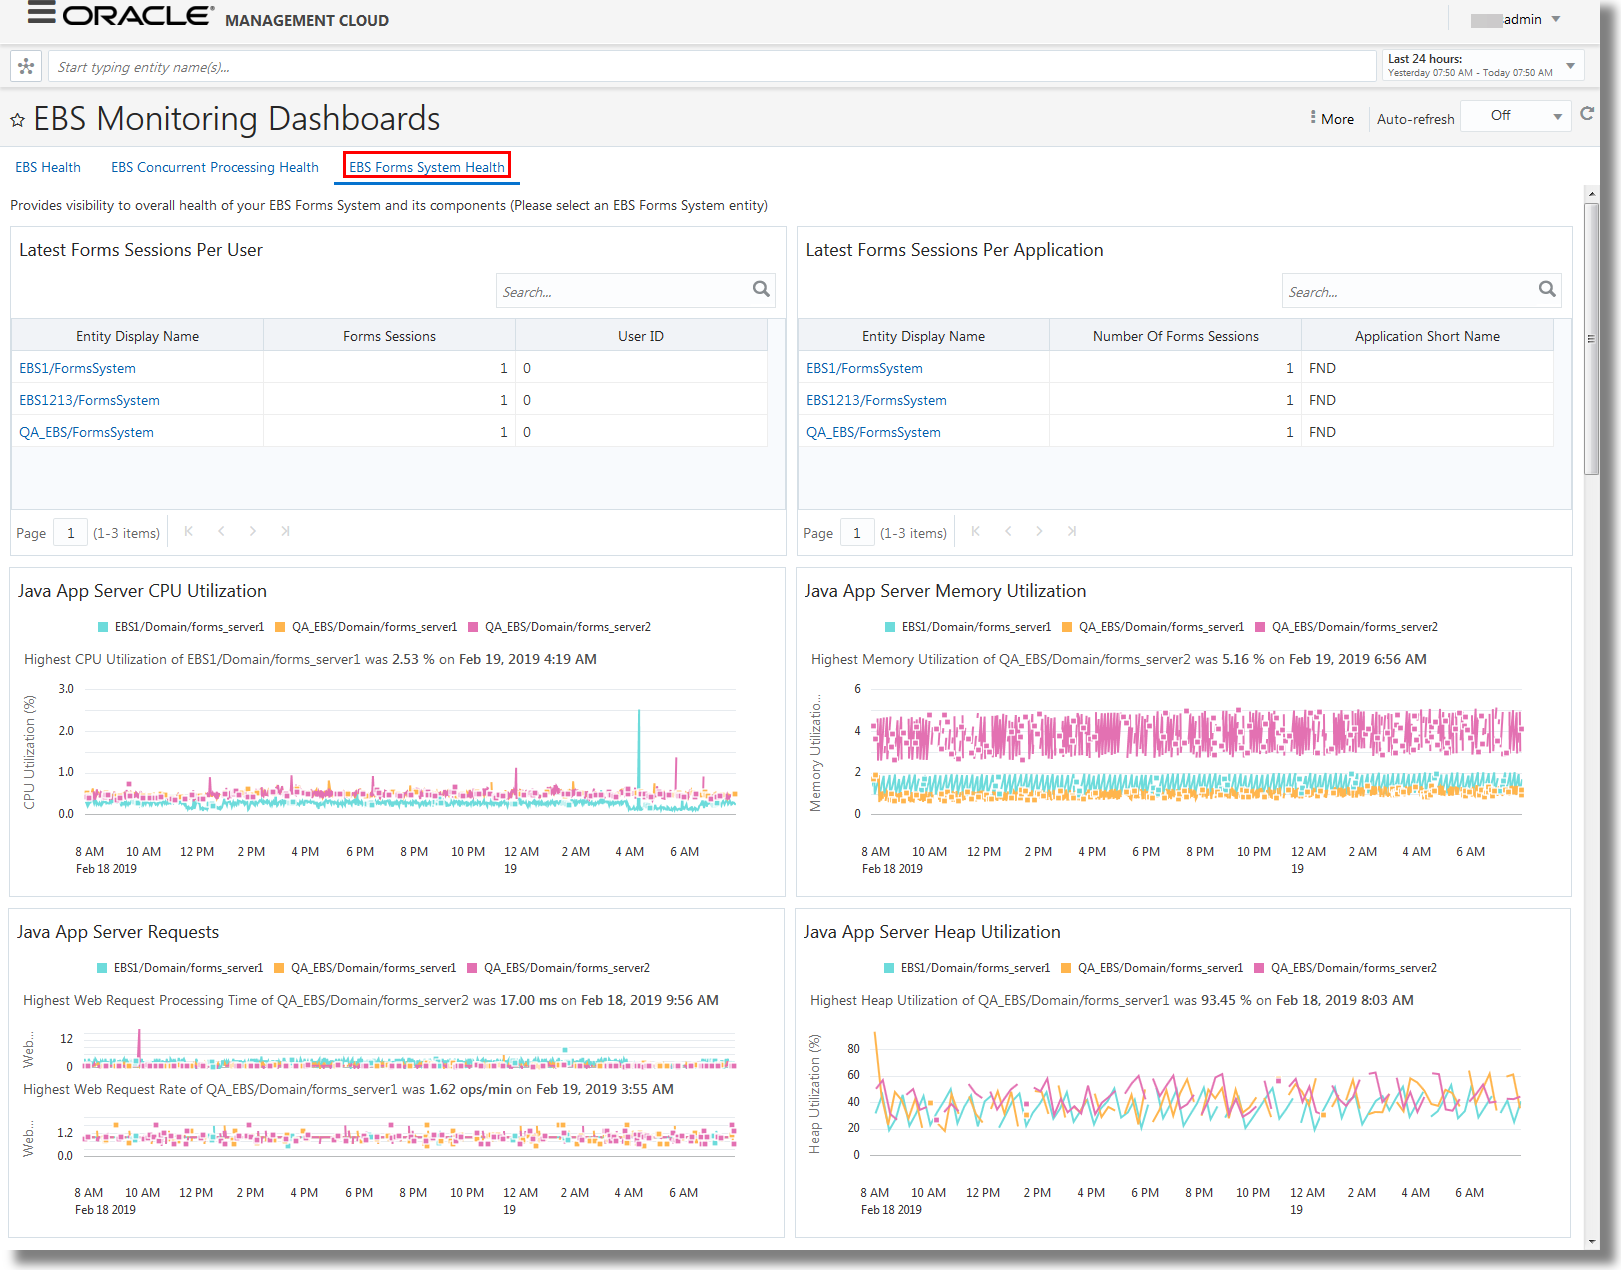
Here’s an example EBS Forms System Health dashboard:
The following widgets are available on the EBS Forms System Health dashboard:
-
Forms Sessions Per User: Displays a chart of the number of forms sessions run per user for all the users.
-
Forms Sessions Per Application: Displays a chart of the number of forms sessions run per application for all the applications.
-
Java App Server CPU Utilization: Shows the percentage utilization of the host CPU by the Forms WebLogic Cluster in Oracle E-Business Suite Release 12.2.
-
Java App Server Memory Utilization: Shows the percentage utilization of the host memory by the Forms WebLogic Cluster in Oracle E-Business Suite Release 12.2.
-
Java App Server Requests: Displays a chart of the number of requests handled by the Forms WebLogic Cluster against time in Oracle E-Business Suite Release 12.2.
-
Java App Server Heap Utilization: Shows the percentage utilization of the host heap memory by the Forms WebLogic Cluster Oracle E-Business Suite Release 12.2.
To view complete information in the widgets Forms Sessions Per User and Forms Sessions Per Application, ensure that you've evrified the collection of forms sessions data. See Verify Collection of Forms Sessions Data.
Note:
-
Click on the parameters on the right side of the visualizations to view the details of each parameter.
-
Some of the widgets have an additional capability of rolling up the entity and time data to view the results in a larger landscape.
EBS Workflow Health
You can view the overall health of your workflow group composite entity and its components by using the EBSWorkflow Health dashboard.
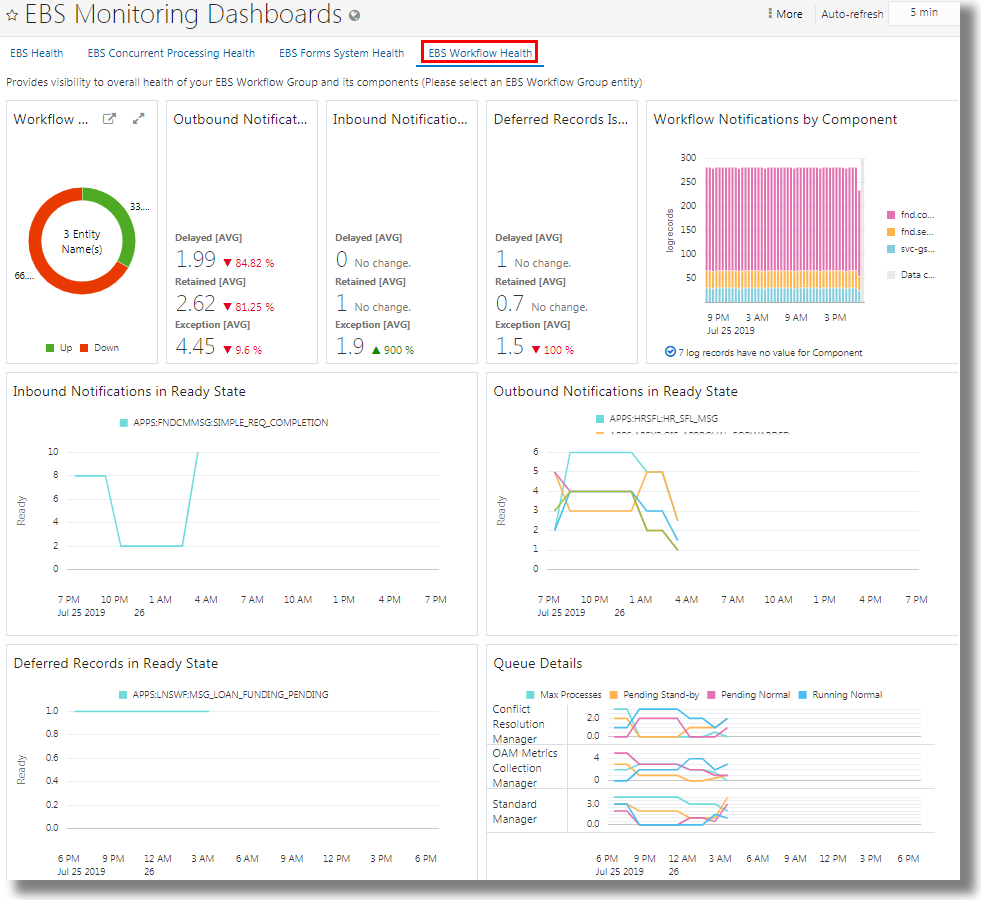
Here’s an example EBS Workflow Health dashboard:
The following widgets are available on the EBS Workflow Health dashboard:
-
Workflow Member Entities Status: Displays the status of the entities in the workflow group.
-
Outbound Notification Issues: Displays the issues noticed in the outbound notifications like Delayed, Retained, or Exception.
-
Inbound Notification Issues: Displays the issues noticed in the inbound notifications like Delayed, Retained, or Exception.
-
Deferred Records Issues: Displays the issues noticed in the deferred records like Delayed, Retained, or Exception.
-
Workflow Notifications by Component: Summarizes the notifications obtained from the log records, grouped by component.
-
Inbound Notifications in Ready State: Displays a line graph denoting the number of inbound notifications that are in ready state for each component.
-
Outbound Notifications in Ready State: Displays a line graph denoting the number of outbound notifications that are in ready state for each component.
-
Deferred Records in Ready State: Displays a line graph denoting the number of deferred records that are in ready state for each component.
-
Queue Details: Displays line graphs for all the concurrent queues with the information like Max Processes, Pending Stand-by, Pending Normal, and Running Normal.
