Analyze Current I/O Trend and Forecast Activity
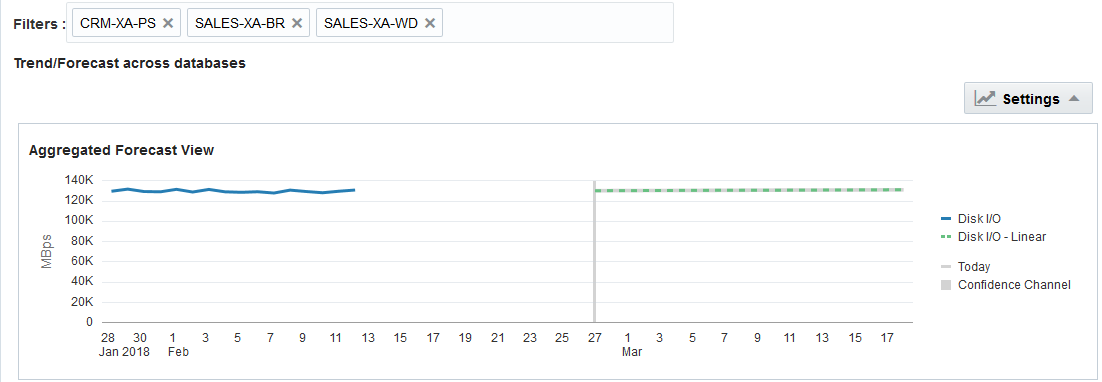
From the Aggregated Forecast View chart, you can view the current trend of I/O activity, and use this trend to forecast future I/O activity.
For the Database Resource Analytics application to forecast your resource utilization for a year, there must be at least 13 months of data stored in the Oracle IT Analytics warehouse. The forecast value is more accurate when there’s more data stored in theOracle IT Analytics warehouse.
You can use the current and forecast I/O activity to plan your database capacity.
For example, if the forecast I/O activity is at a high level, then you must ensure that you have sufficient resources to support the elevated I/O activity.
