3 Set Up Alert Rules
The Oracle Management Cloud Administrator can create alert rules from the Alerts Home Page. Alerts rules can be customized for each area in Oracle Management Cloud.
Configure PeopleSoft Alert Rules on Infrastructure Monitoring
Configure alert rules for your monitored infrastructure to trigger alerts based on specific criteria. You can use the out-of-the-box templates available to create the alert rule.
Required Role: To complete these tasks, you must have the Oracle Management Cloud Administrator role.
- From the Management Cloud main menu, select Administration and then Alert Rules. The Alert Rules page is displayed.
- In the Service list, select Monitoring. Click Create Alert Rule. The Create Alert Rule page is displayed.
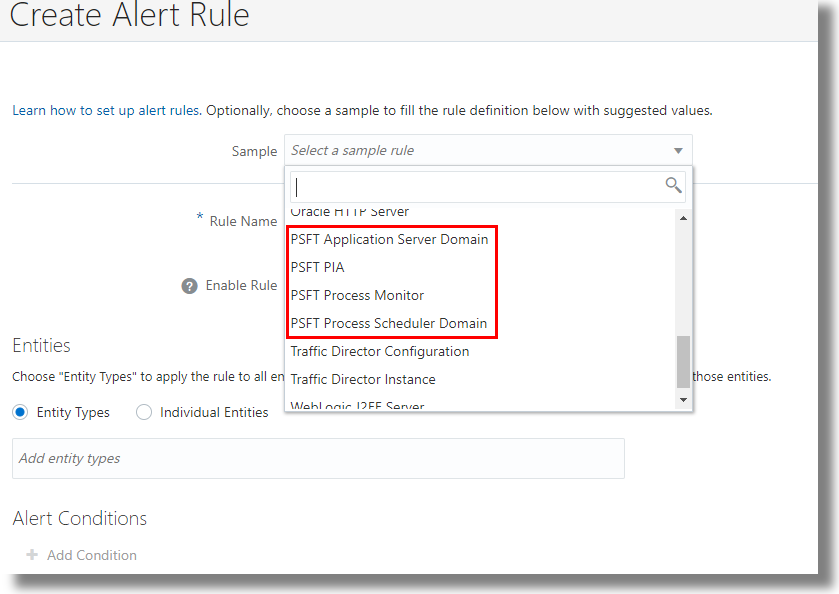
- From the Sample rule list, select from the sample PeopleSoft rules:
- PSFT PIA
- PSFT Application Server Domain
- PSFT Scheduler Server Domain
- PSFT Process Monitor
The following image shows the Create Alert Rule page with the list of PeopleSoft sample alert rules:

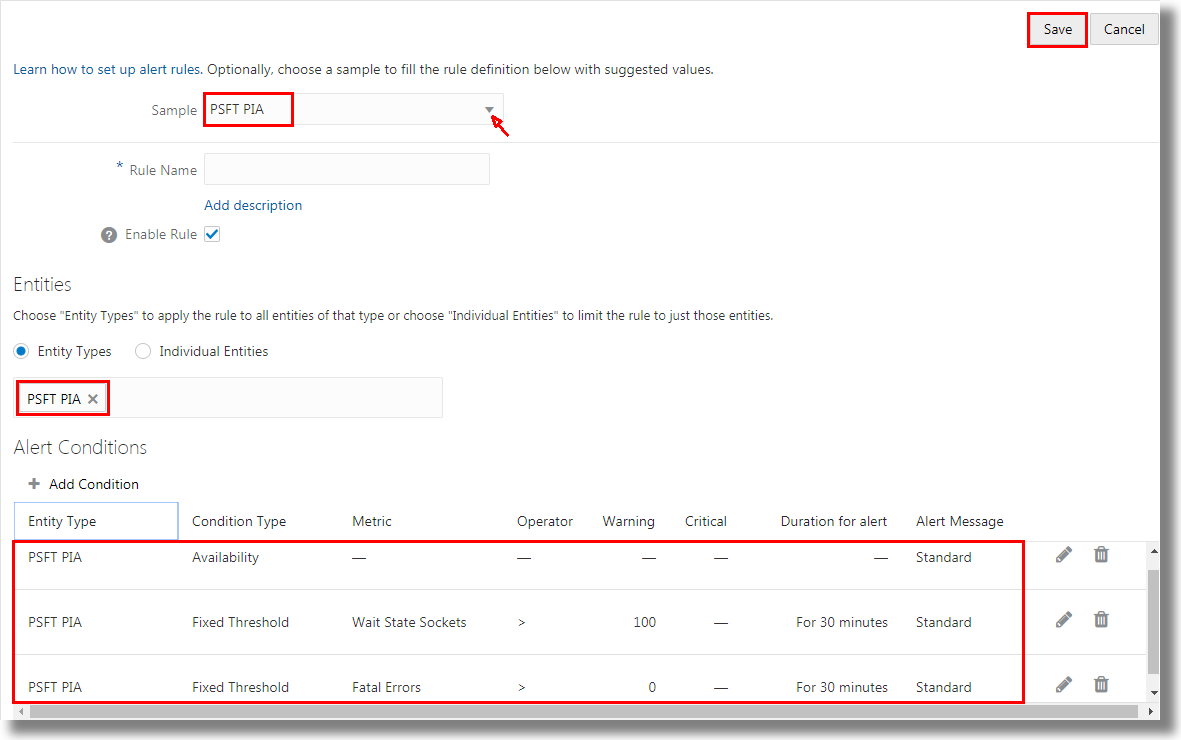
The following image shows the Create Alert Rule page with the PSFT PIA sample rule:

By default, the template already has the entity type, and alert conditions set for PeopleSoft Pure Internet Architecture (PIA) entity.
You can modify the above settings to suit the requirement of your setup.
- In the field Rule Name, specify a name for the rule that you create. Provide description of the rule.
- To alter an alert condition, click the Edit icon. You can change the alert condition parameters such as Condition Type, Metric, Alert Message, and the details of the condition. Click Save.
To delete an alert condition from the rule, click the Delete icon.
- Under Notifications, you can specify the recipients who must receive notifications when any result violates the specified alert condition.
- Click Save.
To create your custom alert rule by defining the entity type, see Set Up Alert Rules in Using Oracle Infrastructure Monitoring.
The Alert Conditions created for the four PeopleSoft sample alert rule templates are listed below:
Sample Alert Rule: PSFT PIA
| Condition Type | Evaluation Time Period | Metric | Warning | Description |
|---|---|---|---|---|
| Availability | NA | Status | NA | The availability status |
| Metric | 30 | Wait State Sockets | > 100 | Web server sockets that are in WAIT state |
| Metric | 30 | Fatal Errors | > 0 | Fatal errors in the JOLT Service servlet logs |
Sample Alert Rule: PSFT Application Server Domain
| Condition Type | Evaluation Time Period | Metric | Warning | Critical | Description |
|---|---|---|---|---|---|
| Availability | NA | Status | NA | NA | The availability status |
| Metric | 30 | Average Service Request Execution Time | > 10000 | NA | Average service request execution time in milliseconds |
| Metric | 30 | Queued Processes for Application Server | NA | > 1 | Queued Processes for Application Server |
| Metric | 30 | Queued Processes for BRK Dispatcher | NA | > 1 | Queued processes for publication broker dispatcher |
| Metric | 30 | Queued Processes for BRK Handler | NA | > 1 | Queued processes for publication broker handler |
| Metric | 30 | Queued Processes for PUB Dispatcher | NA | > 1 | Queued processes for publication contractor dispatcher |
| Metric | 30 | Queued Processes for PUB Handler | NA | > 1 | Queued processes for publication contractor handler |
| Metric | 30 | Queued Processes for SUB Dispatcher | NA | > 1 | Queued processes for subscription contractor dispatcher |
| Metric | 30 | Queued Processes for SUB Handler | NA | > 1 | Queued processes for subscription contractor handler |
| Metric | 30 | Failed Server Processes | NA | > 0 | Server processes that have failed or are down within the domain |
| Metric | 30 | State Files | > 0 | NAs | PeopleTools state files generated in the domain logs directory |
Sample Alert Rule: PSFT Scheduler Server Domain
| Condition Type | Evaluation Time Period | Metric | Critical | Description |
|---|---|---|---|---|
| Availability | NA | Status | NA | The availability status |
| Metric | 30 | Queued Processes for PSDSTSRV | > 1 | Queued processes for distribution server (PSDSTSRV) |
| Metric | 30 | Queued Processes for PSPRCSRV | > 1 | Queued processes for process scheduler (PSPRCSRV) |
| Metric | 30 | Failed Server Processes | > 0 | Server processes that have failed or are down within the domain |
Sample Alert Rule: PSFT Process Monitor
| Condition Type | Evaluation Time Period | Metric | Critical | Description |
|---|---|---|---|---|
| Availability | NA | Status | NA | The availability status |
| Metric | 30 | Number of PSFT processes with an active distribution state value of Not Posted | > 1 | Too many process in distribution not posted state |
| Metric | 30 | Number of PSFT processes with an active run state value of No Success | > 1 | Too many process in run No Success state |
| Metric | 30 | Number of PSFT processes with a run status value of Error per minute since the last collection | > 0 | Too many process in run Error state |
Configure Alert Rules on Other Oracle Management Cloud Components
Create dedicated alert rules for each component:
| Platform Area | Details |
|---|---|
| Log Analytics | It generates an alert when an anomaly or a deviation from the fixed threshold is detected in the log data.
See Create an Alert Rule in Using Oracle Log Analytics. |
| Application Performance Monitoring | In Oracle Application Performance Monitoring, alerts are created for fixed thresholds, anomalies, and early warnings for metrics on Pages, AJAX calls, and Server Requests.
See Create Alert Rules in Using Oracle Application Performance Monitoring. |