Validate Log Collections
Post configuring your log collection, perform these tasks to validate a successful setup.
Note:
Security Monitoring and Analytics may take up to 30 minutes for log data to start showing.Validation Scenario 1
- Set the timeframe to reflect the expected timeframe in the logs being sent. If implementing a new log source to send current logs set the timeframe to "Last Hour" or some shortened timeframe to focus on the most recent logs ingested by SMA.
- Run a generic query in Security Data Explorer, to view logs being ingested by a data element unique to the new log source being created. If the new source is the first of it's kind then filtering by "Log Source" will be sufficient to see when those new logs start to show up in SMA using a basic visualization like pie/bar chart or summary table.
- Query examples include:
- 'SEF Record Type' = base | stats count by 'Log Source'
- 'SEF Record Type' = base and 'Log Source' = 'Bluecoat Proxy W3C Logs' | stats count by 'Log Source'
Validation Scenario 2
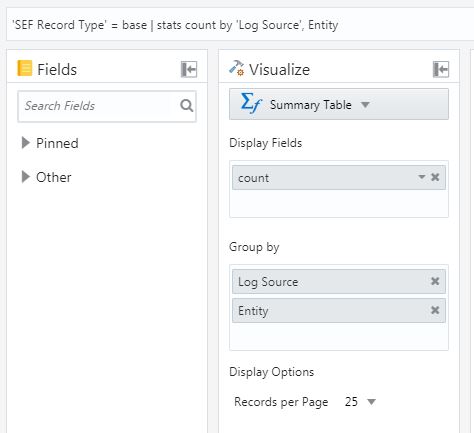
- If the new log source is an addition to existing source, like a newly created Oracle database, a Summary Table organized by 'Log Source' and 'Entitiy' will display all the entitiy names per log source type. Look for the name of the new 'Entitiy' created in the previous steps.
- Query examples include:
- View all entity names by log source 'SEF Record Type' = base | stats count by Log Source', Entity'
Figure A-1 Filtering logs image

- View all entitiy names for a specific log source: 'SEF Record Type' = base AND 'Log Source' = 'Linux Cron Logs' | stats count by 'Log Source', Entity
- View all entity names by log source 'SEF Record Type' = base | stats count by Log Source', Entity'