About Overview Dashboards
The Overview Dashboards typically present a limited number of metrics centered on a business topic that show the state of the business.
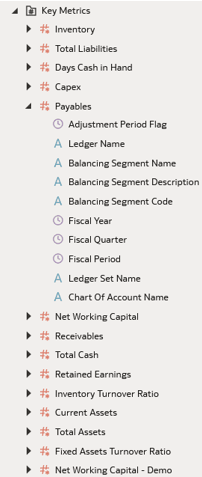
Composite visualizations on these depict an aggregate number for a specific business metric alongside a more detailed visualization that further illuminates that metric usually over time. These metrics are underpinned by their respective key metrics contained in a subject area or dataset. Key metrics are reusable across content and provide an opportunity for a common, shared business understanding.

