Printing and Viewing Diagnostic Messages
To assist with debugging, use the diagnostic log to view the runtime diagnostic messages your scripts have written to the log, as well as any exception stack traces that coding errors have produced at runtime.
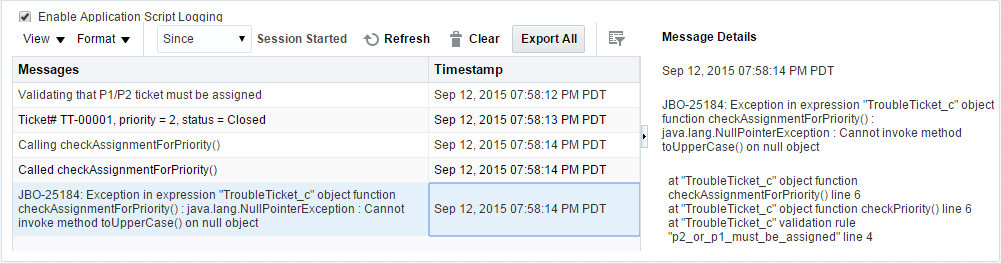
On entering the diagnostic log viewer, if the Enable Application Script Logging check box is checked, then all of the messages from your current session are shown. The diagnostic console toolbar reflects this by showing that you are viewing all messages Since Session Started. As shown in the figure below, the messages are shown by default in chronological order and the display is scrolled to view the most recent messages. When an exception has occurred, additional details on the call stack where the error occurred are visible in the Message Details panel at the right.