Using the tag latencies report
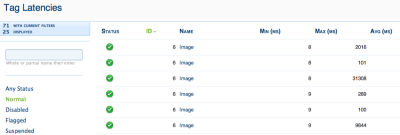
You can use the tag latency report to monitor and display the minimum, maximum, and average load timing per tag. You can then identify and remove non-responsive or abnormally slow tags. Global and schedule-specific latency thresholds are measured against the Avg (ms) column.
To use the tag latencies report:
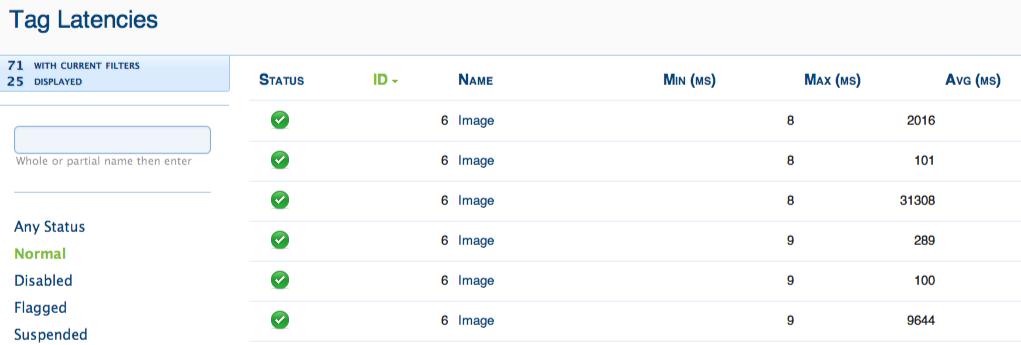
- Select Report > Tag Latencies. The Tag Latencies page opens.
- The following status indicators appear in the Status column.
Status icon Description 
Normal 
Disabled 
Flagged 
Suspended Tip: You can view the missed tag fire opportunities caused by a suspended tag in the tag report.
The following diagram illustrates how the UXG uses tag latency to move a tag's status from a Normal to Flagged to Suspended state:
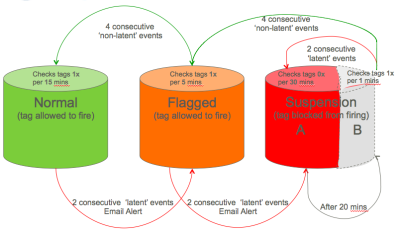
-
The tag latencies report includes the following columns:
Column Description ID The system-assigned identification number for the tag. Click to sort the tag list by the tag ID. Name The user-assigned name for the tag. Click to sort the Tag list by the Tag Name. Min (ms) The minimum observed latency period, in milliseconds, for the tag in the specified time interval. Click to sort the tag list by the Minimum latency. Max (ms) The maximum observed latency period, in milliseconds, for the tag in the specified time interval. Click to sort the tag list by Maximum latency. Avg (ms) The average observed latency, in milliseconds, for the tag in the specified time interval. Click to sort the tag list by the Average Latency. Date The date and time interval (by hour) for the specified tag.

User Experience Guard (UXG) overview
Resetting the UXG for flagged or suspended tags


